This code is a supplementary material for the paper Neutral competition boosts chaos in food webs, by Pablo Rodríguez-Sánchez, Egbert H. van Nes and Marten Scheffer.
When run with the default options, it reproduces from scratch all the results and figures shown in the paper.
This software was developed and tested with Matlab R2017b (9.3.0.713579) (win64).
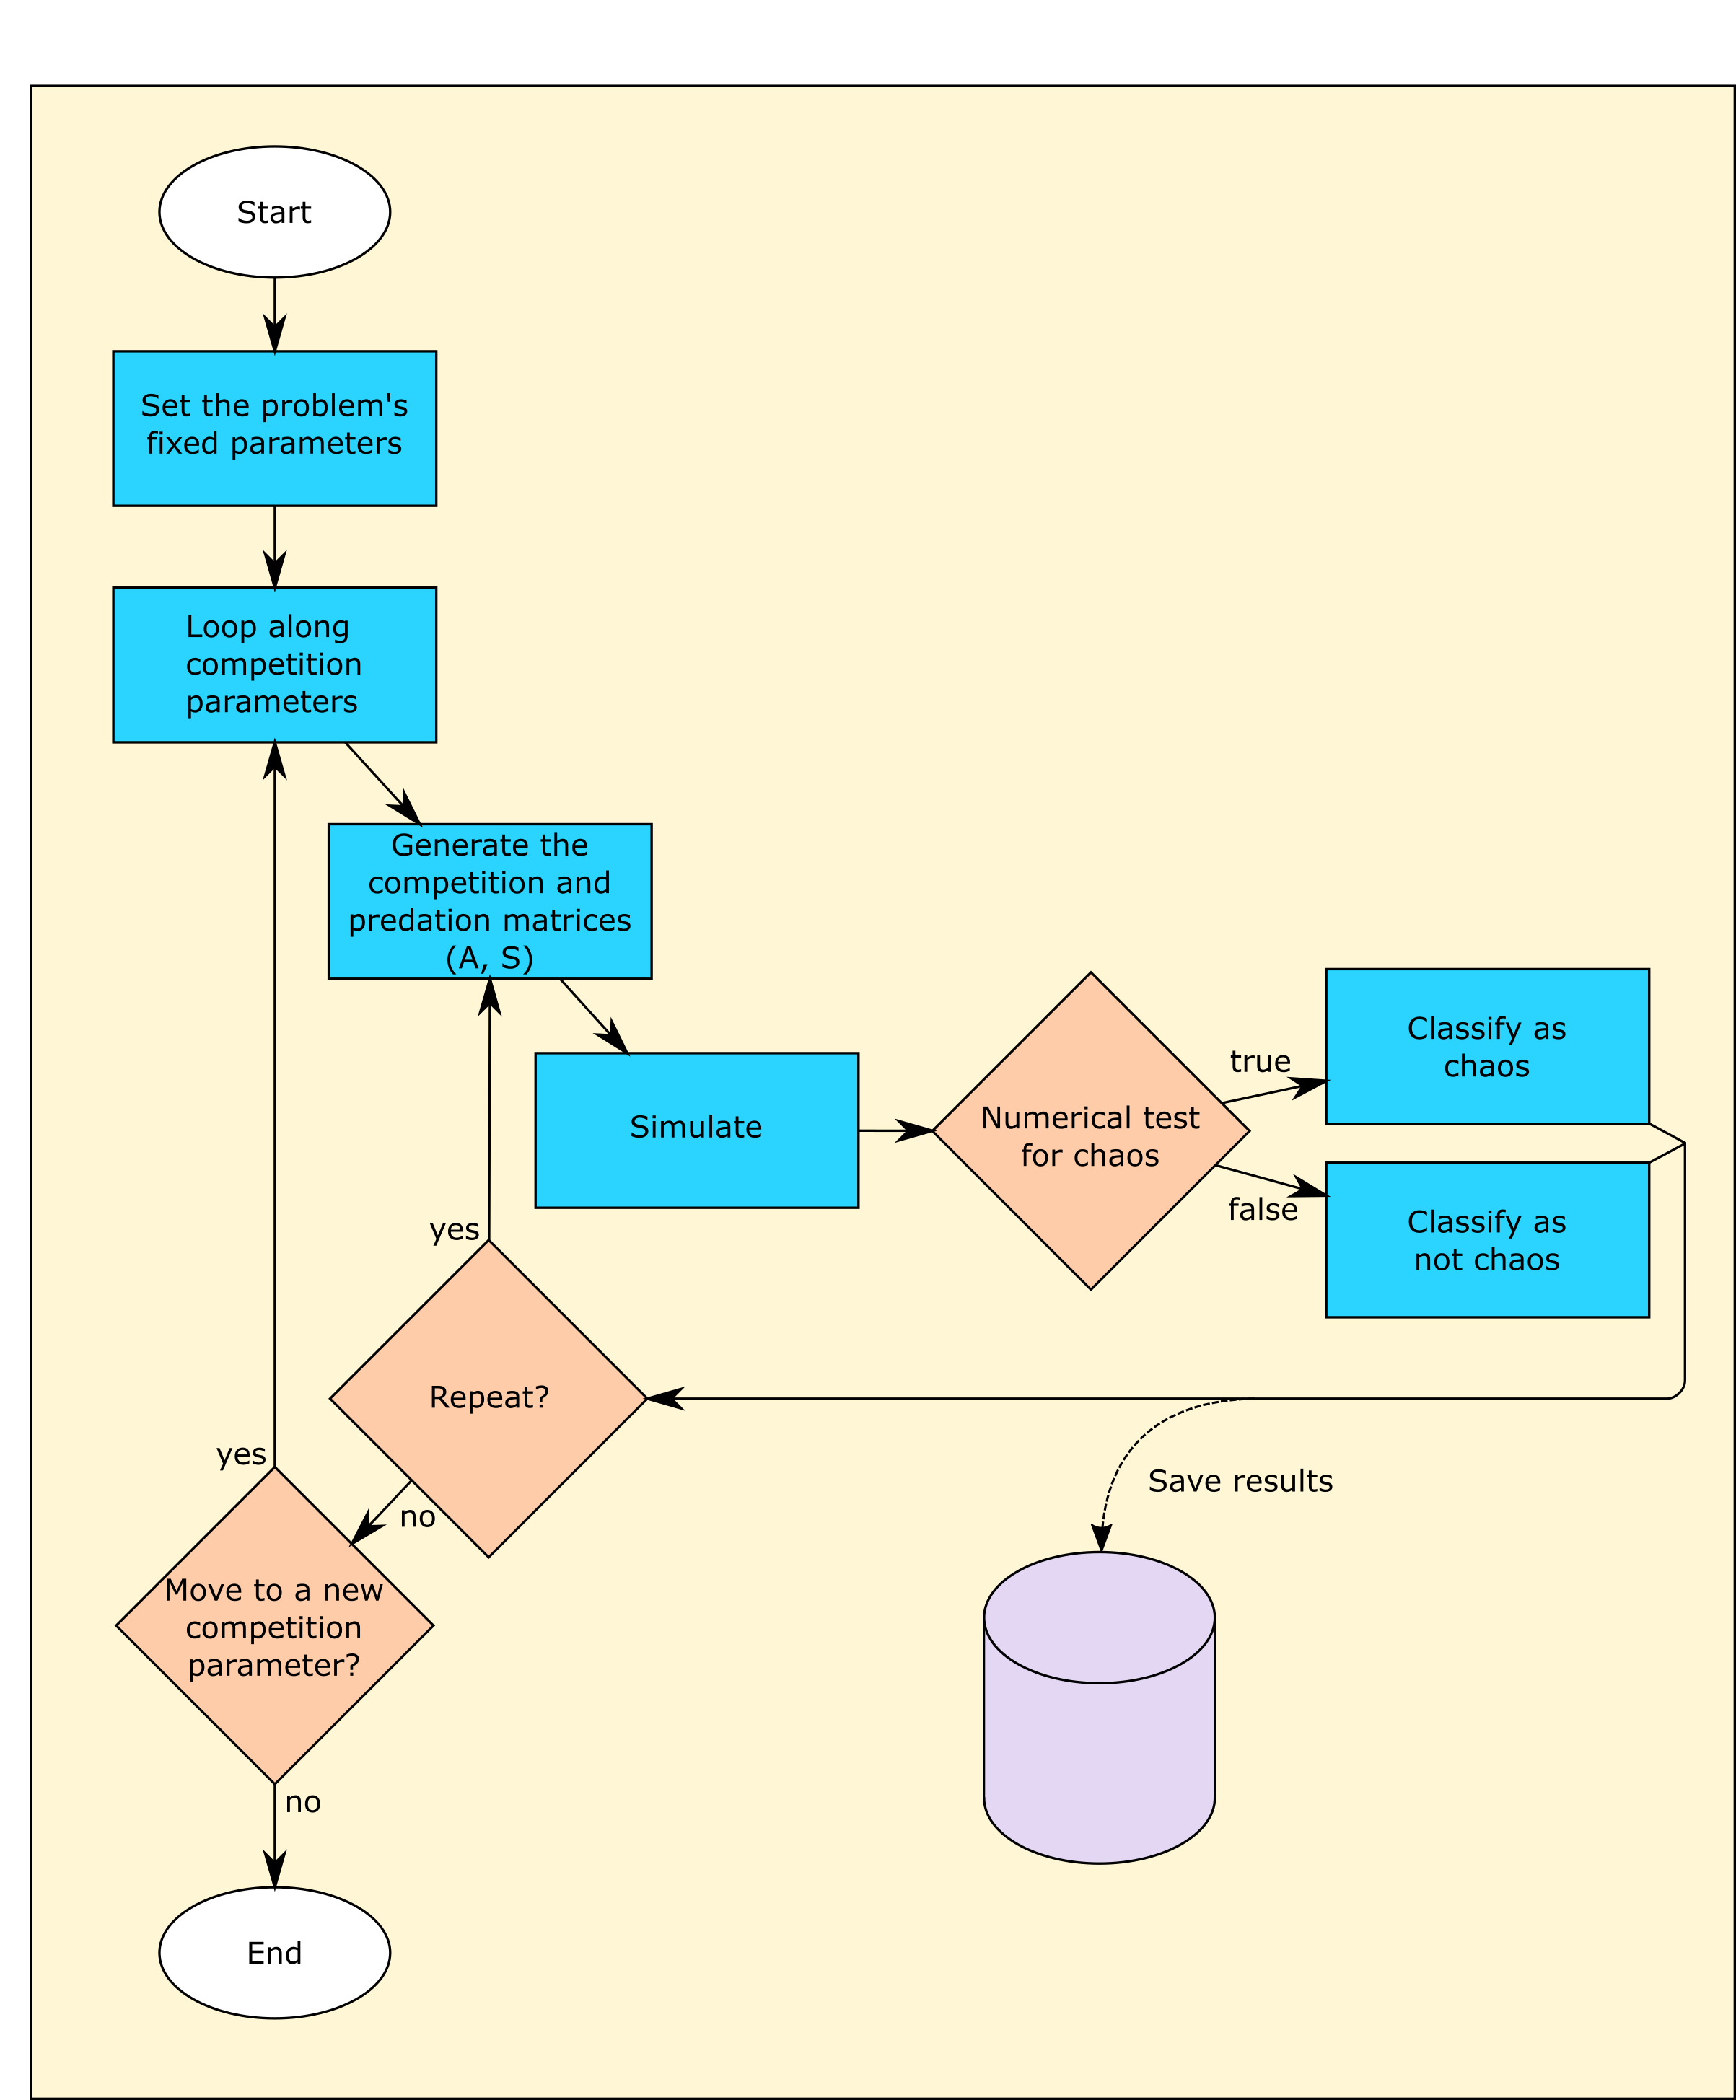
This collection of scripts simulates and analyzes a set of modelled ecosystems. In particular, we are interested in the effects of different types of competition on the asymptotic dynamics exhibited. More information here.
Each individual ecosystem is described by a differential equation, being the dynamics those of a generalized Rosenzweig-MacArthur equation [1]. A competition parameter is introduced to sweep smoothly between dominant intraspecific competition and dominant interspecific competition. For each value of the competition parameter, several instances of the system are simulated, differing in predation rates and initial conditions.
The main purpose of the analysis is to classify each individual simulation as chaotic or non-chaotic. In order to do so, two parallel approaches are used: estimation of the maximum Lyapunov exponent [2], and Gottwald-Melbourne z1 test [3].
- Download or clone all files
- Add all folders and subfolders to Matlab's path.
- (Optional). Browse to the
testfolder and executetest_run.mto test the integrity of the package (it takes around 20 seconds in a standard personal computer). If you are familiar with the Matlab Unit testing engine,runtestscan also be used here. - Browse to the main folder, and execute
launch.m. This will reproduce all data and figures used in the paper.
Please note that the typical run time in a standard personal computer is around 1.2 days (that is, roughly 3 hours per active row in the input file) and requires around 49 Gb of disk space.
If you want to re-use the code for your own simulations, please note that the parameters of the experiment(s) to be run are specified in /io/input.csv (more information below).
The expected input is the file /io/input.csv. This csv file contains the following fields:
- id: identification string. The name of the simulation.
- active: the simulation is executed only if active is true. Otherwise, it is ignored.
- nPreys: number of prey species to simulate.
- nPreds: number of predator species to simulate.
- r: prey's growth rate (d^-1).
- K: prey's carrying capacity (mg l^-1).
- g: predation rate (d^-1).
- f: immigration rate (mg l^-1 d^-1).
- e: assimilation efficiency.
- H: half-saturation constant (mg l^-1).
- l: predator's loss rate (d^-1).
- width: width of the competition window.
- simTime: simulation time. Length of the time series in days.
- stabilTime: numerical stabilization time. Used to reach an attractor and minimize the effects of the initial conditions.
- steps: number of time steps. Length of the time series in steps.
- lyapTime: length of the simulation (in days) used for estimating the Lyapunov exponent.
- lyapPert: initial perturbation used for estimating the Lyapunov exponent.
- reps: number of times the experiment should be repeated. Provided some dynamical parameters are randomly generated, different runs will lead to different time series. Repeating the simulation opens the possibility of a statistical analysis.
- compPars: string containing details to reconstruct the competition parameters to be tested. The structure is: "start step medium step end". For instance: -1 0.05 0 0.2 1 generates the concatenation of -1:0.05:0 and 0.2:0.2:1
- seed: seed for the random number generator. Fixing the seed ensures reproducitiblity of simulations involving random numbers. If you don't know how this works, just use any integer number (0, 1, ...).
- results_folder: path where the analysis results will be stored.
- timeseries_folder: path where the timeseries will be stored. The timeseries may require some Gb of disk space. This feature is currently disabled.
id;active;nPreys;nPreds;r;K;g;f;e;H;l;width;simTime;stabilTime;steps;lyapTime;lyapPert;reps;compPars;seed;results_folder;timeseries_folder
sim1;true;2;3;0.5;10;0.4;1e-5;0.6;2;0.15;0.2;5000;2000;5000;100;1e-8;200;-0.9 0.05 0 0.2 0.9;1;io/;io/
sim2;true;4;6;0.5;10;0.4;1e-5;0.6;2;0.15;0.2;5000;2000;5000;100;1e-8;200;-0.9 0.05 0 0.2 0.9;1;io/;io/
| id | active | nPreys | nPreds | r | K | g | f | e | H | l | width | simTime | stabilTime | steps | lyapTime | lyapPert | reps | compPars | seed | results_folder | timeseries_folder |
|---|---|---|---|---|---|---|---|---|---|---|---|---|---|---|---|---|---|---|---|---|---|
| sim1 | true | 2 | 3 | 0.5 | 10 | 0.4 | 1e-5 | 0.6 | 2 | 0.15 | 0.2 | 5000 | 2000 | 5000 | 100 | 1e-8 | 200 | -0.9 0.05 0 0.2 0.9 | 1 | io/ | io/ |
| sim2 | true | 4 | 6 | 0.5 | 10 | 0.4 | 1e-5 | 0.6 | 2 | 0.15 | 0.2 | 5000 | 2000 | 5000 | 100 | 1e-8 | 200 | -0.9 0.05 0 0.2 0.9 | 1 | io/ | io/ |
Please note that the separators are:
- semicolon ( ; ) for new column
- new line for new row
The output is a set of m files, one per numerical experiment. Its filename coincides with the field id in the input file, that is, experiment with id sim1 will generate the file /io/sim1.m.
It contains the variable resultsArray, a cell of structs. Each individual struct contains information about an individual simulation.
The fields are:
- id: identification string. The name of the simulation.
- dims: the dimensions of the systems. In the form [number of predator species, number of prey species]
- stabilTime: numerical stabilization time. Used to reach an attractor and minimize the effects of the initial conditions.
- competition_par: the value of the competition parameter for the selected simulation.
- maxLyapunov: the estimated maximum Lyapunov exponent for this simulation.
- chaosTests: a struct containing booleans (true/false) for a couple of different tests of chaoticity.
-
This work was supported by funding from the European Union’s Horizon 2020 research and innovation programme for the ITN CRITICS under Grant Agreement Number 643073.
-
The function z1test was adapted, with permission of the author, from GRIND for Matlab.
