Live Link: https://petralee2019.github.io/Visualizing-Data-with-Leaflet/
For USGS (United States Geological Survey) visualization project, I have visualized earthquakes occurring globally using a live API feed provided by the USGS. The USGS is responsible for providing scientific data about natural hazards, the health of our ecosystems and environment; and the impacts of climate and land-use change. The data is updated every 5 mins, and includes all earthquake data for the Past 7 Days. Additional layer of tectonic plates to understand the relationship between tectonic plates and seismic activites is also included.
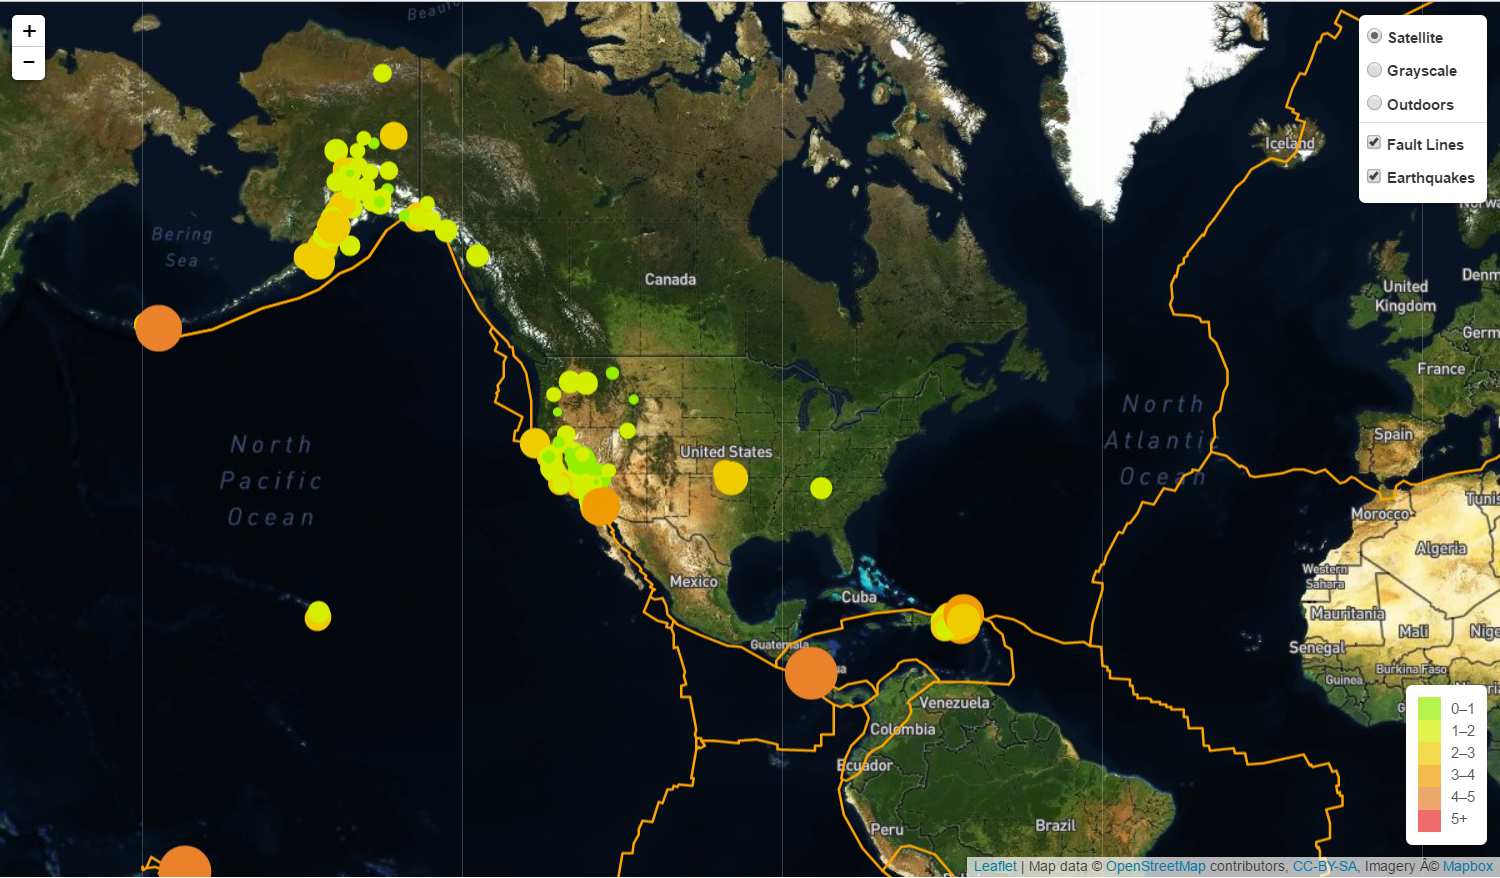

Many people don't know how much seismic activity is happening around them all the time. Did you know that Southern California has over 10,000 earthquakes each year alone? This project is an example of how toa use Leaflet.js to visualize geoJSON data. The javascript uses Leaflet layer control using basemaps and overlay maps. Below is a screenshot of the visualization.
Web application is deployed at the following link:
Technology stack used in developing this web application is as follows: Leaflet/HTML/CSS/Bootstrap/Javascript/GeoJSON/D3
Data Sources used :
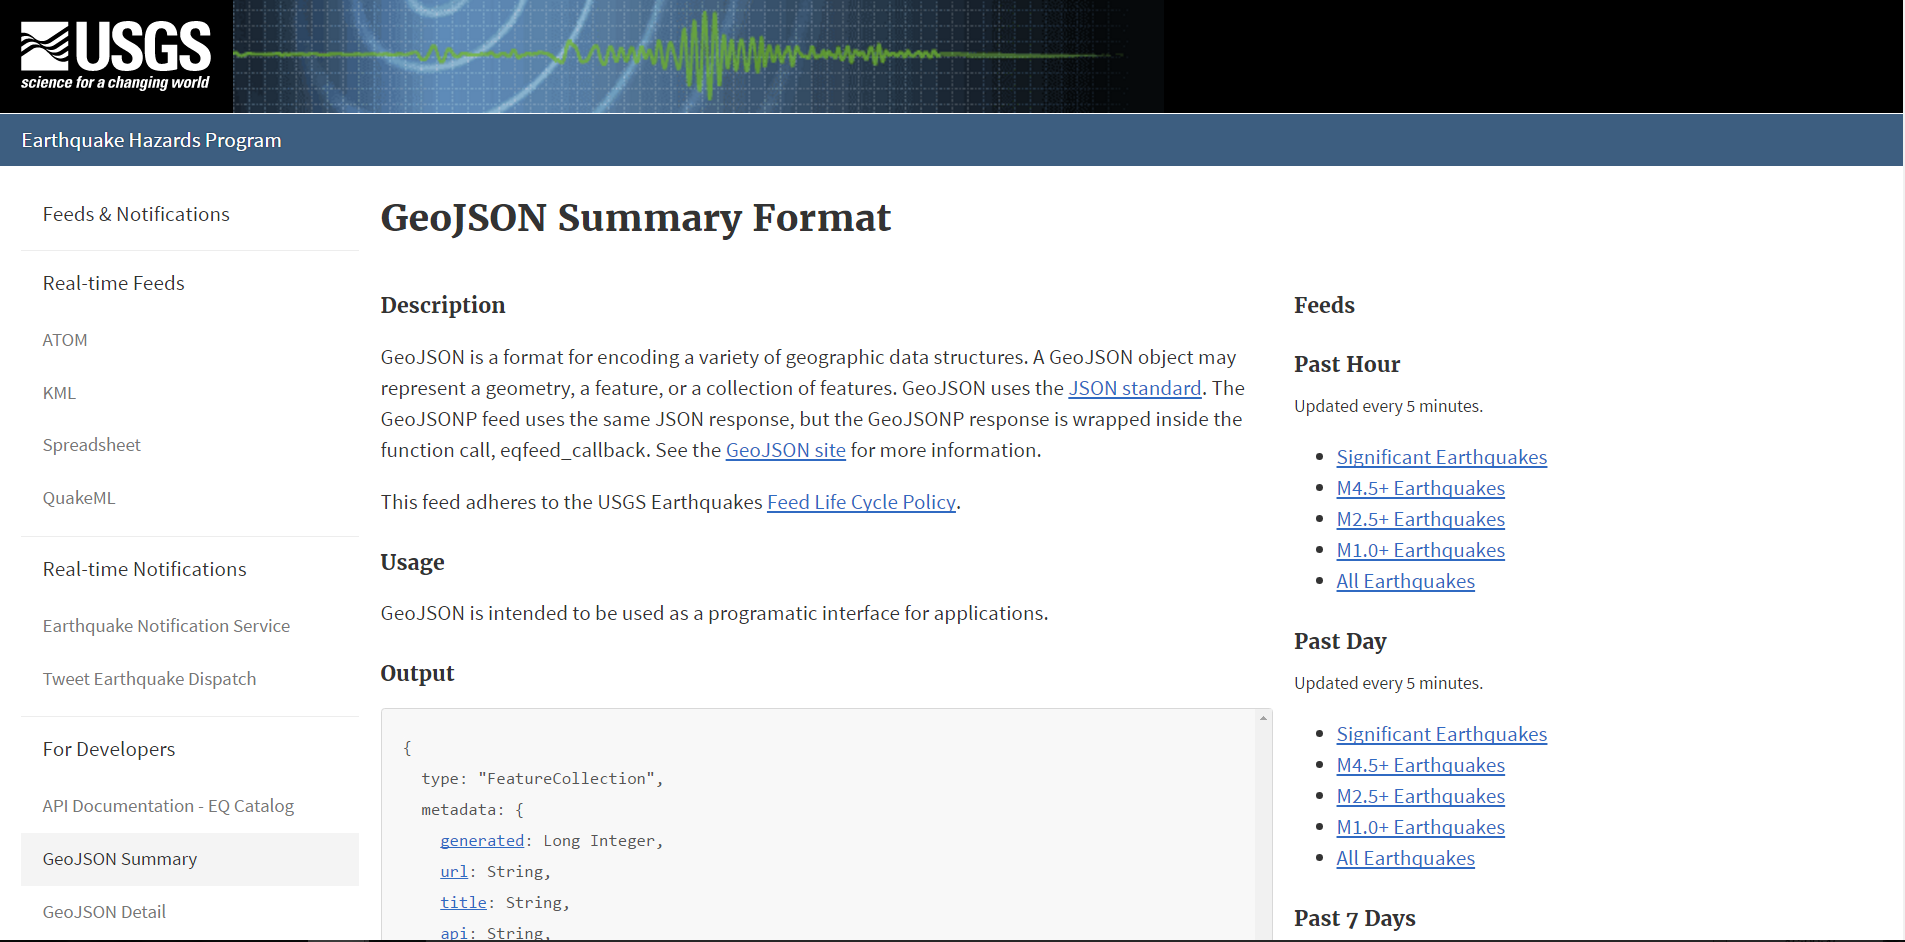
https://earthquake.usgs.gov/earthquakes/feed/v1.0/geojson.php
https://raw.githubusercontent.com/fraxen/tectonicplates/master/GeoJSON/PB2002_boundaries.json