A list of r package r are requiered for run this app in your desk:
| Package | Version used |
|---|---|
| data.table | 1.12.8 |
| DESeq2 | 1.22.2 |
| DT | 0.11 |
| heatmaply | 1.0.0 |
| plotly | 4.9.1 |
| reshape2 | 1.4.3 |
| shiny | 1.4.0 |
| shinydashboard | 0.7.1 |
| tidyverse | 1.3.0 |
- A easy way to check/install this package in your R session, run:
.cran_packages <- c('shiny', 'plotly', 'data.table', 'reshape2', 'DT', 'tidyverse', 'heatmaply')

.bioc_packages <- c('DESeq2')

.inst <- .cran_packages %in% installed.packages()

if(any(!.inst)) {
  install.packages(.cran_packages[!.inst], dep=TRUE, repos='http://cran.us.r-project.org')
}

.inst <- .bioc_packages %in% installed.packages()

if(any(!.inst)) {
  if (!requireNamespace("BiocManager", quietly = T))
    install.packages("BiocManager")
  BiocManager::install(.bioc_packages[!.inst], ask = F, suppressUpdates = T)
}

# Load packages into session, and print package version
sapply(c(.cran_packages, .bioc_packages), require, character.only = TRUE)

# Check version
ip <- installed.packages()[,c(1,3)]

rownames(ip) <- NULL

ip <- ip[ip[,1] %in% c(.cran_packages,.bioc_packages),]

print(ip, row.names=FALSE)
- After check the package installation download the
app.Rfile and run from an r session:
Method 1 (Quick method)
shiny::runGitHub("EDA-Transcriptomic", username = "RJEGR", ref = "master", launch.browser = TRUE, subdir = 'stable/')Method 2
- Click
Clone or downloadbutton on the top of this page, then clickDownload ZIP/tar; - Unzip the file to your working directory (use
getwd()to know your working directory); - Run the code of launching (according to your structure of working directory it may be different).
shiny::runApp("~/EDA-Transcriptomic/", launch.browser = TRUE)- A deployed version can be used from here. Also, you can make or use the toy dataset here and run the launched app:
dds2 <- makeExampleDESeqDataSet(n=10000, m=12)

# Create fake experimental design

design <- rep(0:3, each = 3, times = 1)

design <- paste("G", design, sep="")

colData(dds2)$condition <- factor(design)

dds2 = DESeq(dds2)

m <- data.frame(colData(dds2))

m[,3] <- rep(paste0('rep',1:3), each = 1, times = 4)

m[,4] <- colnames(dds2)

colnames(m) <- c('condition', 'sizeFactor','Rep', 'names')


res <- setResults(dds2, c('G0','G1'))

wd <- '~/Documents/GitHub/EDA-Transcriptomic/toydata/'

write.table(counts(dds2), file = paste0(wd, 'count-toyset.matrix'), quote = F, sep = '\t')

write.table(res, file = paste0(wd, "count-toyset.matrix.G0_vs_G1.DESeq2.DE_results"), sep = '\t', quote = F)
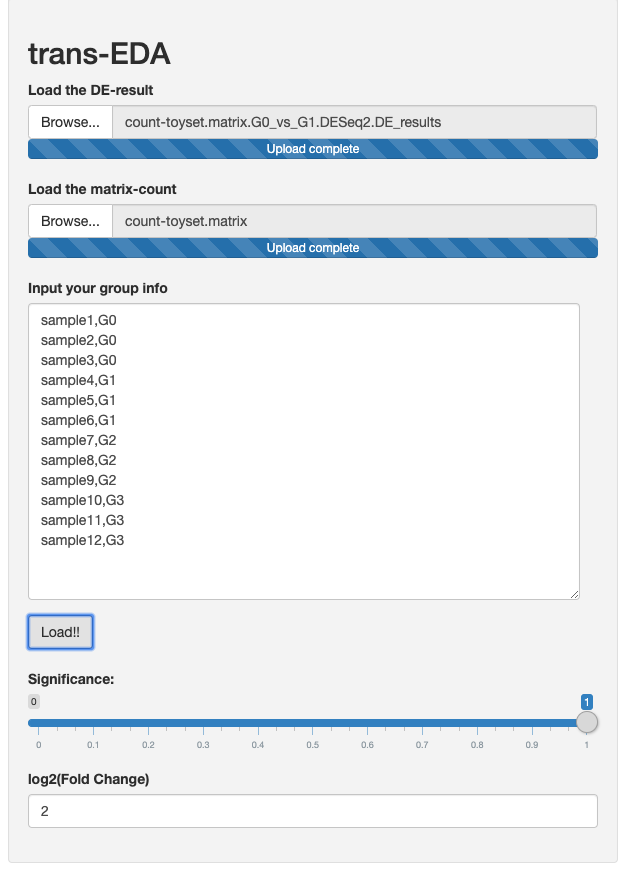
Copy and use the group information in the left-panel box in the app
sample1,G0
sample2,G0
sample3,G0
sample4,G1
sample5,G1
sample6,G1
sample7,G2
sample8,G2
sample9,G2
sample10,G3
sample11,G3
sample12,G3
Example:
