Sensor_Fusion_Radar-Target-Generation-and-Detection
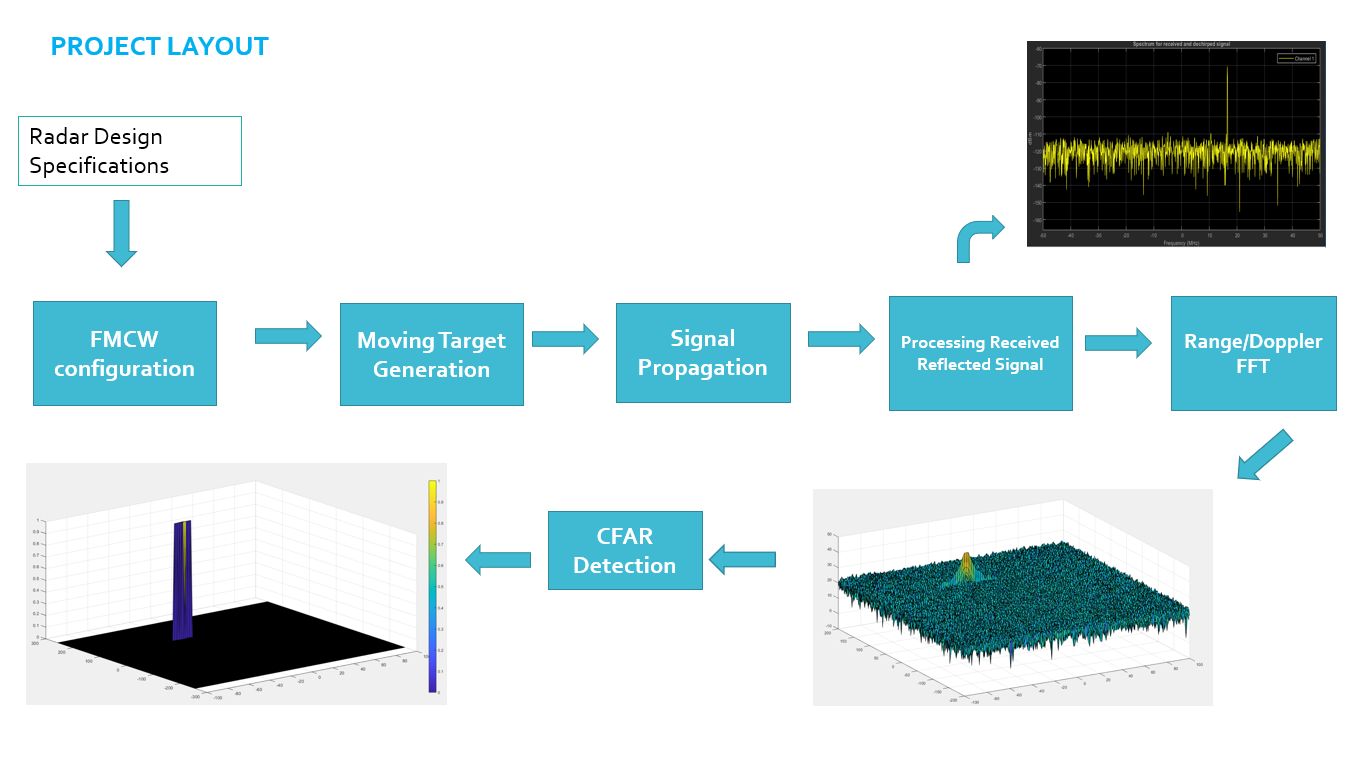
FMCW Waveform Design
- Configure the FMCW waveform based on the system requirements.
- Using the given system requirements, design a FMCW waveform. Find its Bandwidth (B), chirp time (Tchirp) and slope of the chirp.
Simulation loop
- Define the range and velocity of target and simulate its displacement.
- For the same simulation loop process the transmit and receive signal to determine the beat signal
- A beat signal should be generated such that once range FFT implemented, it gives the correct range i.e the initial position of target assigned with an error margin of +/- 10 meters.
Range FFT (1st FFT)
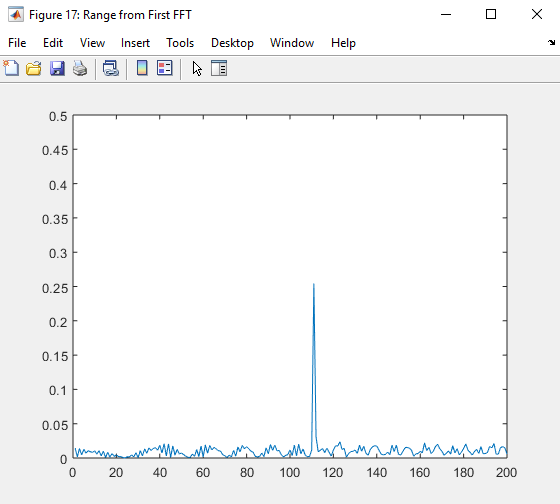
- Perform Range FFT on the received signal to determine the Range
- A correct implementation should generate a peak at the correct range, i.e the initial position of target assigned with an error margin of +/- 10 meters.
FFT Operation
- Implement the 1D FFT on the Mixed Signal
- Reshape the vector into Nr*Nd array.
- Run the FFT on the beat signal along the range bins dimension (Nr)
- Normalize the FFT output.
- Take the absolute value of that output.
- Keep one half of the signal
- Plot the output
- There should be a peak at the initial position of the target
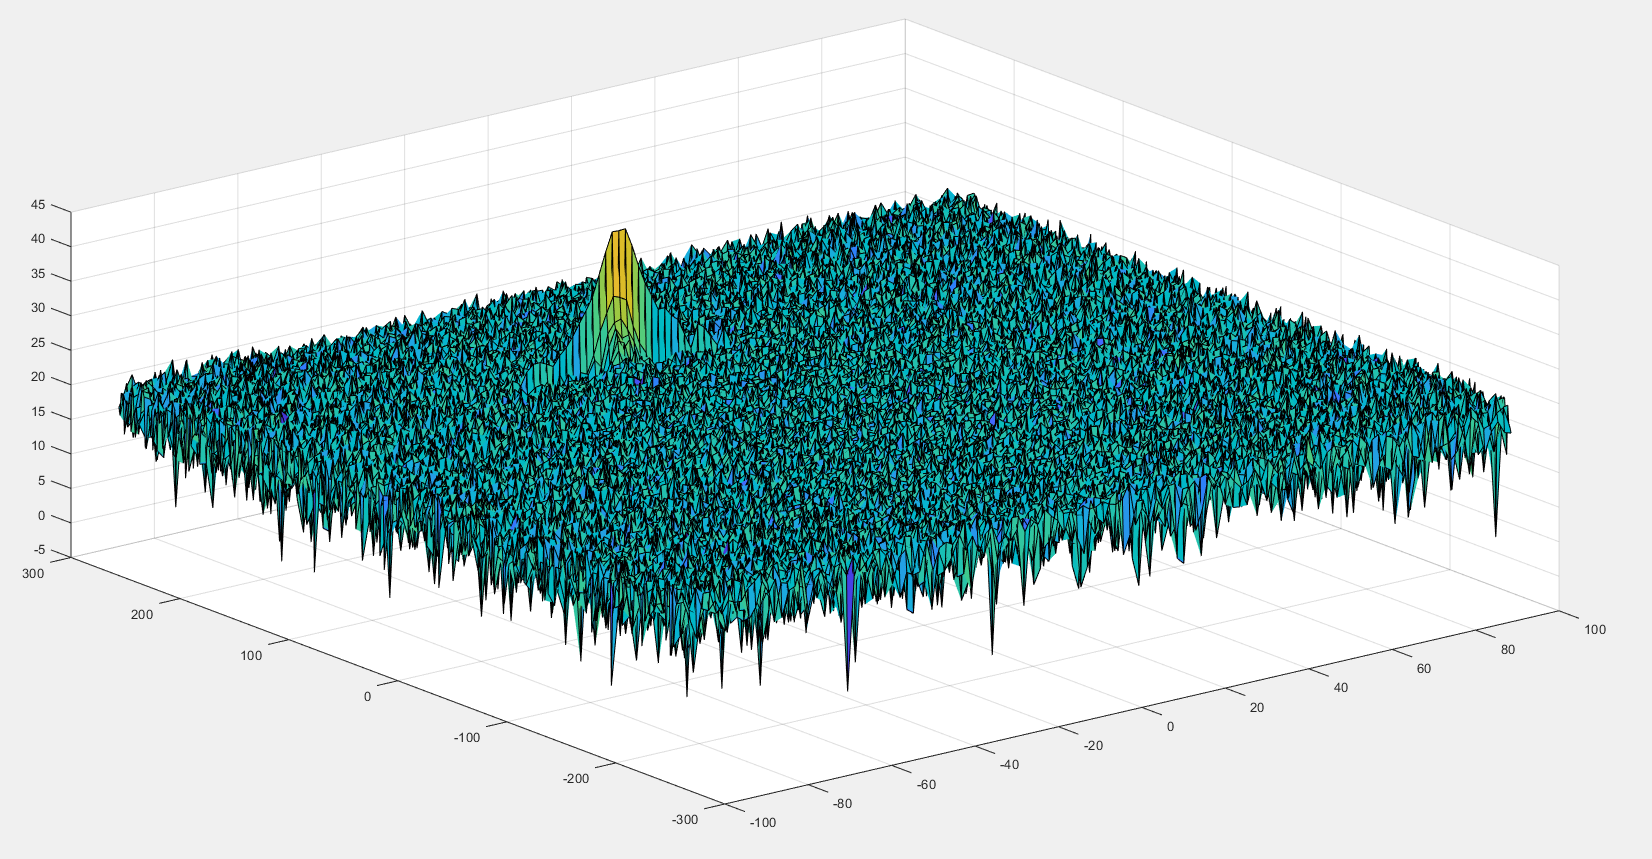
- The 2nd FFT will generate a Range Doppler Map as seen in the image below and it will be given by variable ‘RDM’.
- Next task is to implement the CFAR on this Range Doppler Map.
2D CFAR
-
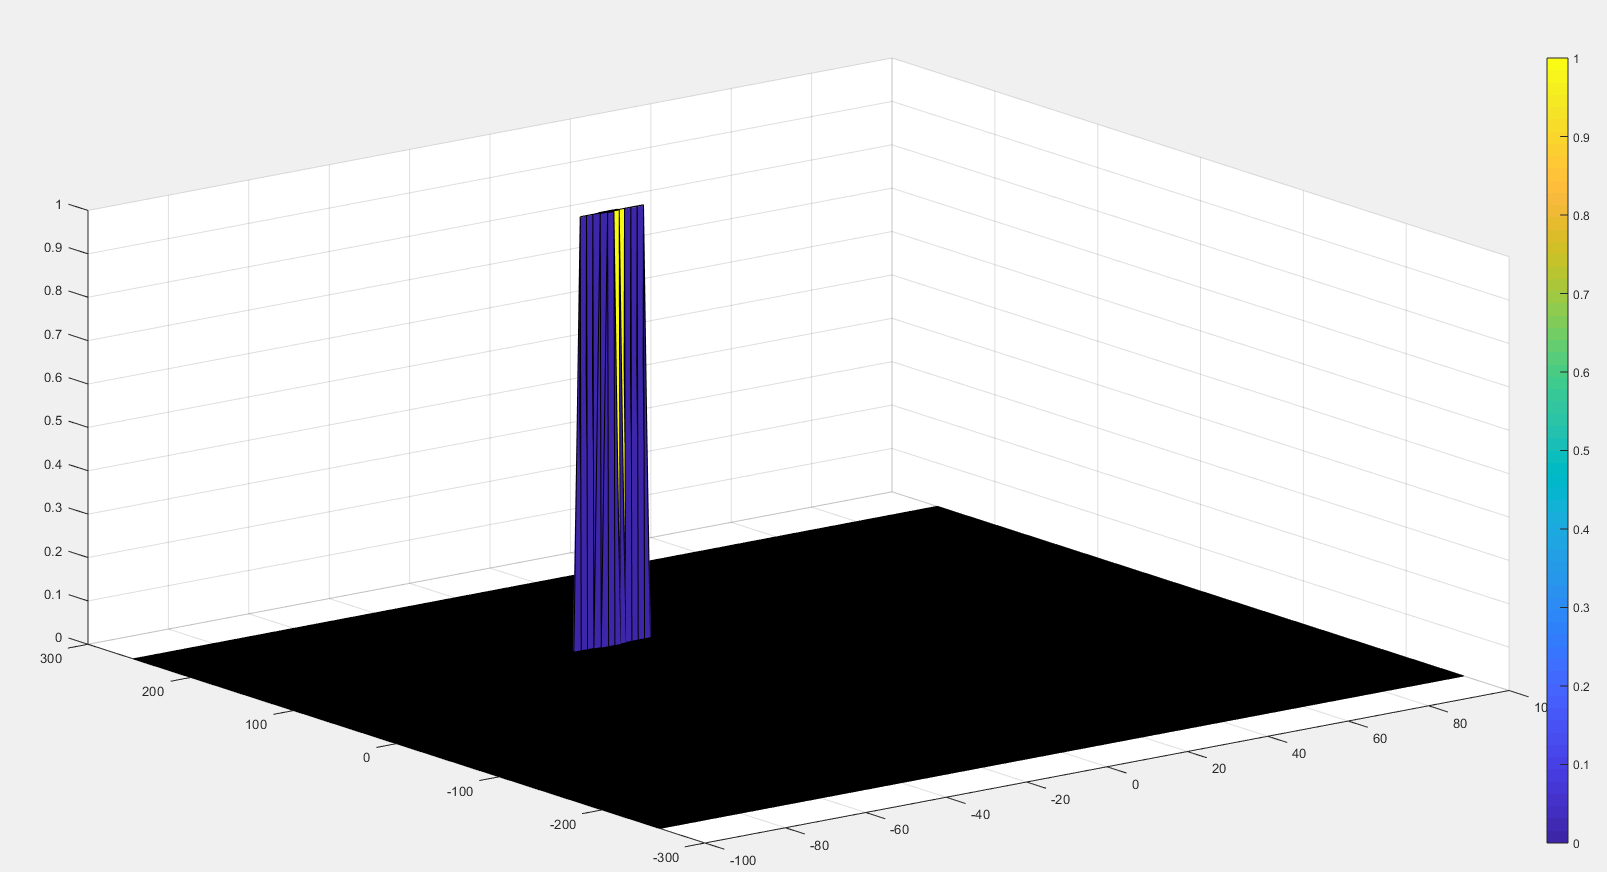
Towards the end, perform the CFAR processing on the output of 2nd FFT to display the target.
-
The 2D CFAR processing should be able to suppress the noise and separate the target signal. The output should match the image shared in walkthrough.
-
Determine the number of Training cells for each dimension. Similarly, pick the number of guard cells.
-
Slide the cell under test across the complete matrix. Make sure the CUT has margin for Training and Guard cells from the edges.
-
For every iteration sum the signal level within all the training cells. To sum convert the value from logarithmic to linear using db2pow function.
-
Average the summed values for all of the training cells used. After averaging convert it back to logarithmic using pow2db.
-
Further add the offset to it to determine the threshold.
-
Next, compare the signal under CUT against this threshold.
-
If the CUT level > threshold assign it a value of 1, else equate it to 0.
-
The process above will generate a thresholded block, which is smaller than the Range Doppler Map as the CUTs cannot be located at the edges of the matrix due to the presence of Target and Guard cells. Hence, those cells will not be thresholded.
-
To keep the map size same as it was before CFAR, equate all the non-thresholded cells to 0.


