I trained and validated a model so it can classify traffic sign images using the German Traffic Sign Dataset. After the model is trained, it was tried out on several images of German traffic signs that I found on the web.
The main execution is Traffic_Sign_Classifier.ipynb.
Also there is a comparison between with and without data augmentation.
The execution without data augmentation is described in Traffic_Sign_Classifier_without_dataAugmentation.html.
The goals / steps of this project are the following:
- Load the data set
- Explore, summarize and visualize the data set
- Design, train and test a model architecture
- Use the model to make predictions on new images
- Analyze the softmax probabilities of the new images
- Summarize the results with a written report
This lab requires:
The lab environment can be created with CarND Term1 Starter Kit. Click here for the details.
- Number of training examples = 34799, and 215000 used in training after data augmentation.
- Number of testing examples = 12630
- Number of validation examples = 4410
- Image data shape = (32, 32, 3)
- Number of classes = 43
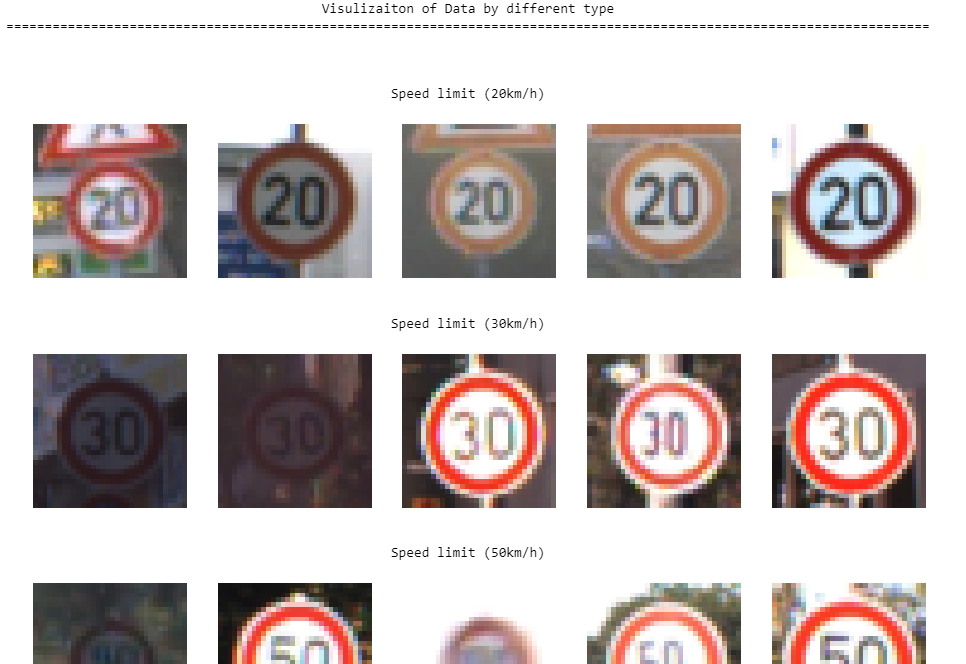
Visualization of the data set and the label.
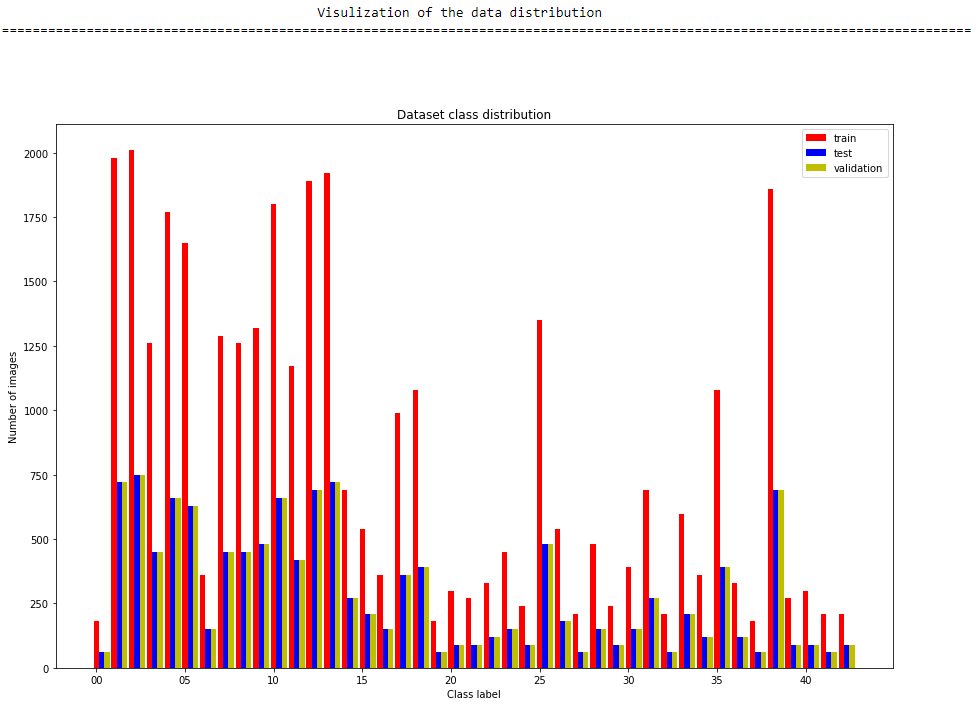
Here is an exploratory visualization of the data set. It is a bar chart showing how the data sets distribution.
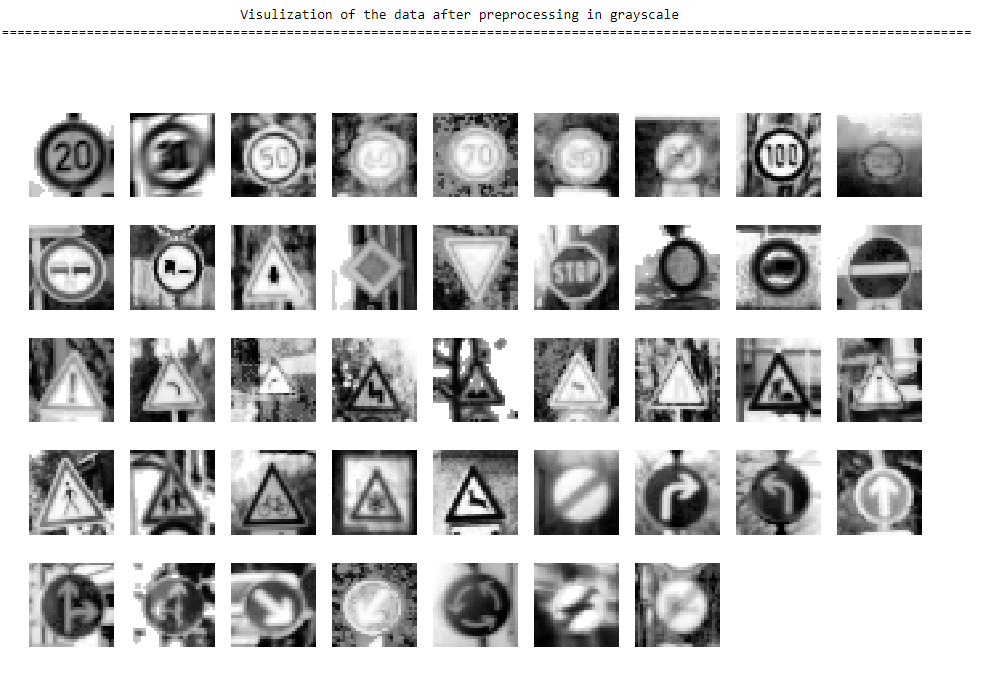
Here I decided to convert the images to grayscale as previous experiments show using gray images produces better results than using color images. Histogram equalization was applied to improve visibility of the signs and normalization with zero mean was used to facilitate the convergence of the optimizer during training. Visualization after the pre-processing.
My final model consisted of the following layers:
| Layer | Description |
|---|---|
| Input | 32x32x1 grayscale images |
| 3x3x12 kernel, stride1, convolution with ReLU activation | outputs 30x30x12 |
| 3x3x24 kernel, stride1, convolution with ReLU activation | outputs 28x28x4 |
| 5x5x36 kernel, stride1, convolution with ReLU activation | outputs 10x10x36 |
| 5x5x48 kernel, stride1, convolution with ReLU activation | outputs 6x6x48 |
| Flatten, concatenate 14x14x24 and 3x3x48 | outputs 5136 |
| First fully connected with 512 neurons and dropout | outputs 512 |
| Second fully connected with 256 neurons and dropout | outputs 256 |
| Outputs with 43 neurons, the number of labels | outputs 43 |
batch_size = 32 keep_prob = 0.7 The maximum number of epochs is 30, and if up to 5 epochs there is no change in the accuracy, the training will be forced to stop. So first I process the data to 32x32x1 images and then I input the training data to the network, getting the logits. And use tf.nn.softmax_cross_entropy_with_logits to get the cross entropy. I use AdamOptimizer to train my model, with a learning rate of 0.0001. In each training epoch, I will shuffle the training data of the single epoch first, and then feed them into the model. After that I will test the accuracy with the epoch’s training data and validation data. And for the two fully connected layers, I keep a keep probability as 0.7 for drop out operation.
My final model results were:
- training set accuracy of 100%
- validation set accuracy of 98.8%
- test set accuracy of 96.69%
The data augmentation has helpped improve the acc, without it, the training results are:
- training set accuracy of 100%
- validation set accuracy of 97.6%
- test set accuracy of 95.566%
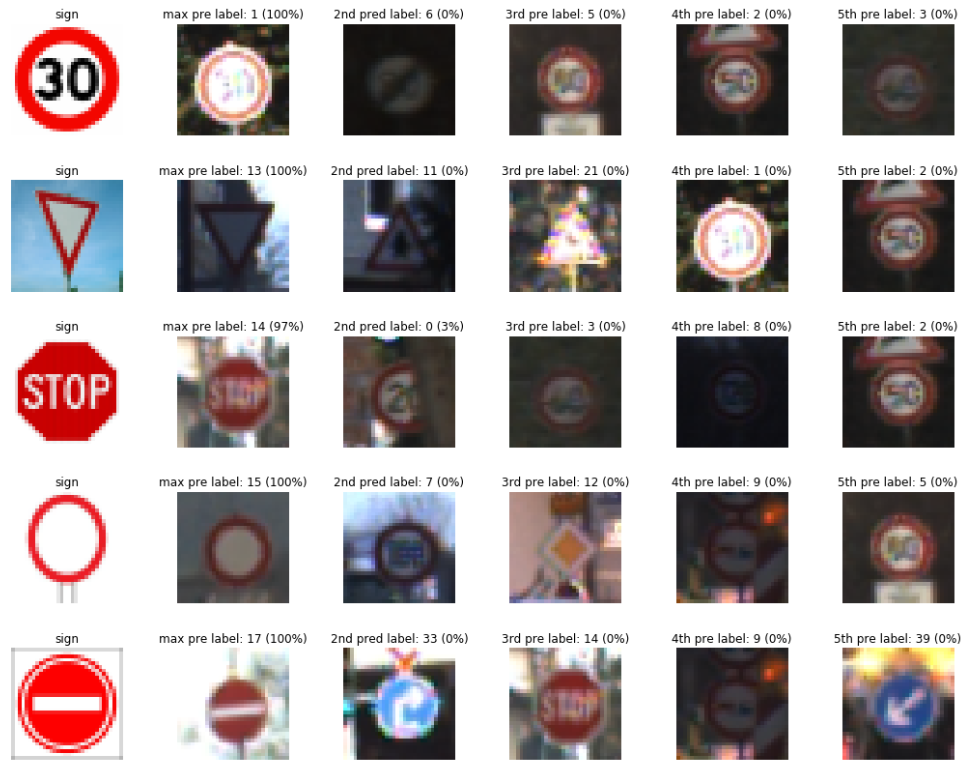
Here are five German traffic signs that I found on the web:
Here are the results of the prediction:
| Image | Prediction |
|---|---|
| 30 km/h | 30 km/h |
| Yield | Yield |
| Stop Sign | Stop sign |
| No vehicle | No vehicle |
| No entry | No entry |
The model was able to correctly guess all of the traffic signs, which gives an accuracy of 100%. This is better compares favorably to the accuracy on the test set of 96.69%.
3. Describe how certain the model is when predicting on each of the five new images by looking at the softmax probabilities for each prediction.
The top 5 softmax probabilities for each image along with the sign type of each probability are shown.
The code for making predictions on my final model is located after the Output Top 5 Softmax Probabilities For Each Image Found on the Web cell of the Ipython notebook.

