Extension for 3D Slicer containing various tools for module development and debugging.
Included modules:
- Python Debugger (in category: Developer Tools): Visual debugging (setting breakpoints, execute code step-by-step, view variables, stack, etc.) of Python scripts in Slicer using PyCharm, Visual Studio Code, Eclipse, etc.
- Node modified statistics (in category: Developer Tools): Module for collecting statistics on timing of node Modified events. It is useful for estimating refresh rate when a live data stream or temporal data sequence is visualized.
- Node info: Browse nodes in the Slicer scene, find referenced and referencing nodes, create dockable widgets to display content of selected nodes.
Authors: Andras Lasso (PerkLab, Queen's University), Mikael Brudfors (Laboratorio de Imagen Medica, Hospital Gregorio Maranon).
Python debuggers:
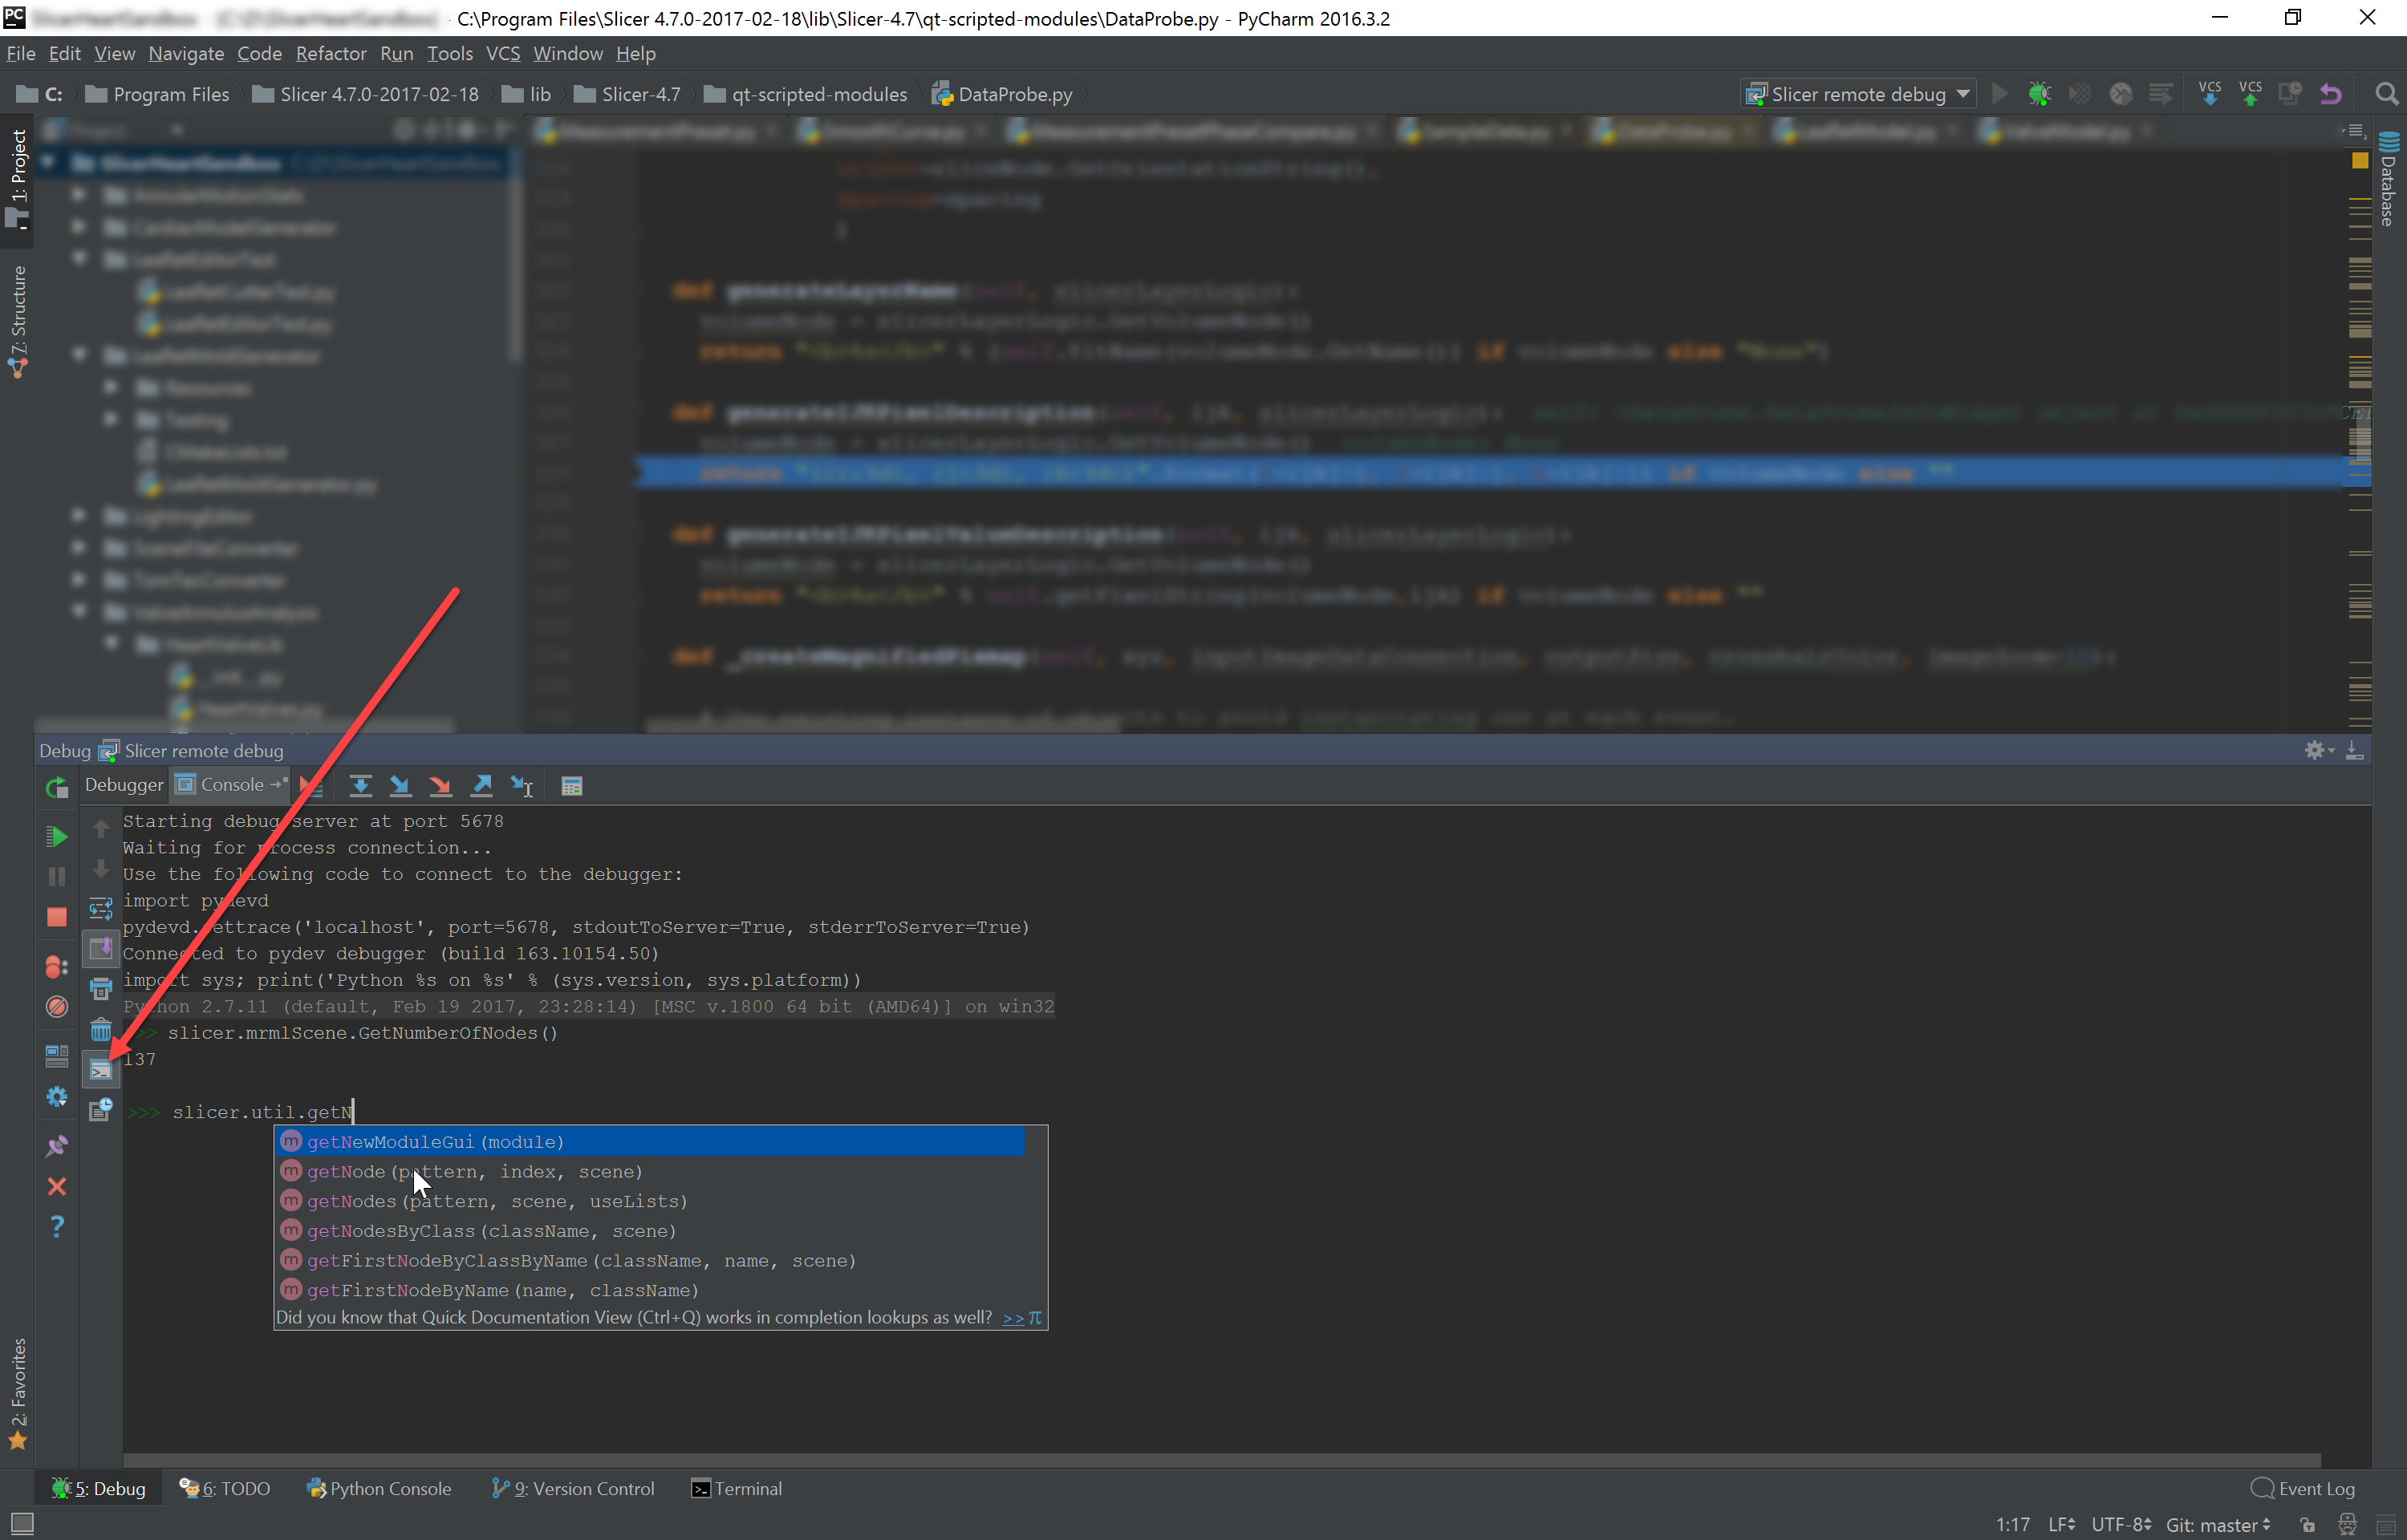
- PyCharm: Easiest to set up and most convenient. Requires professional version, which is only free for academic users.
- Visual Studio: A bit less capable than PyCharm (the debugger cannot automatically reconnect after Slicer is restarted, there is no auto-complete in the Python console).
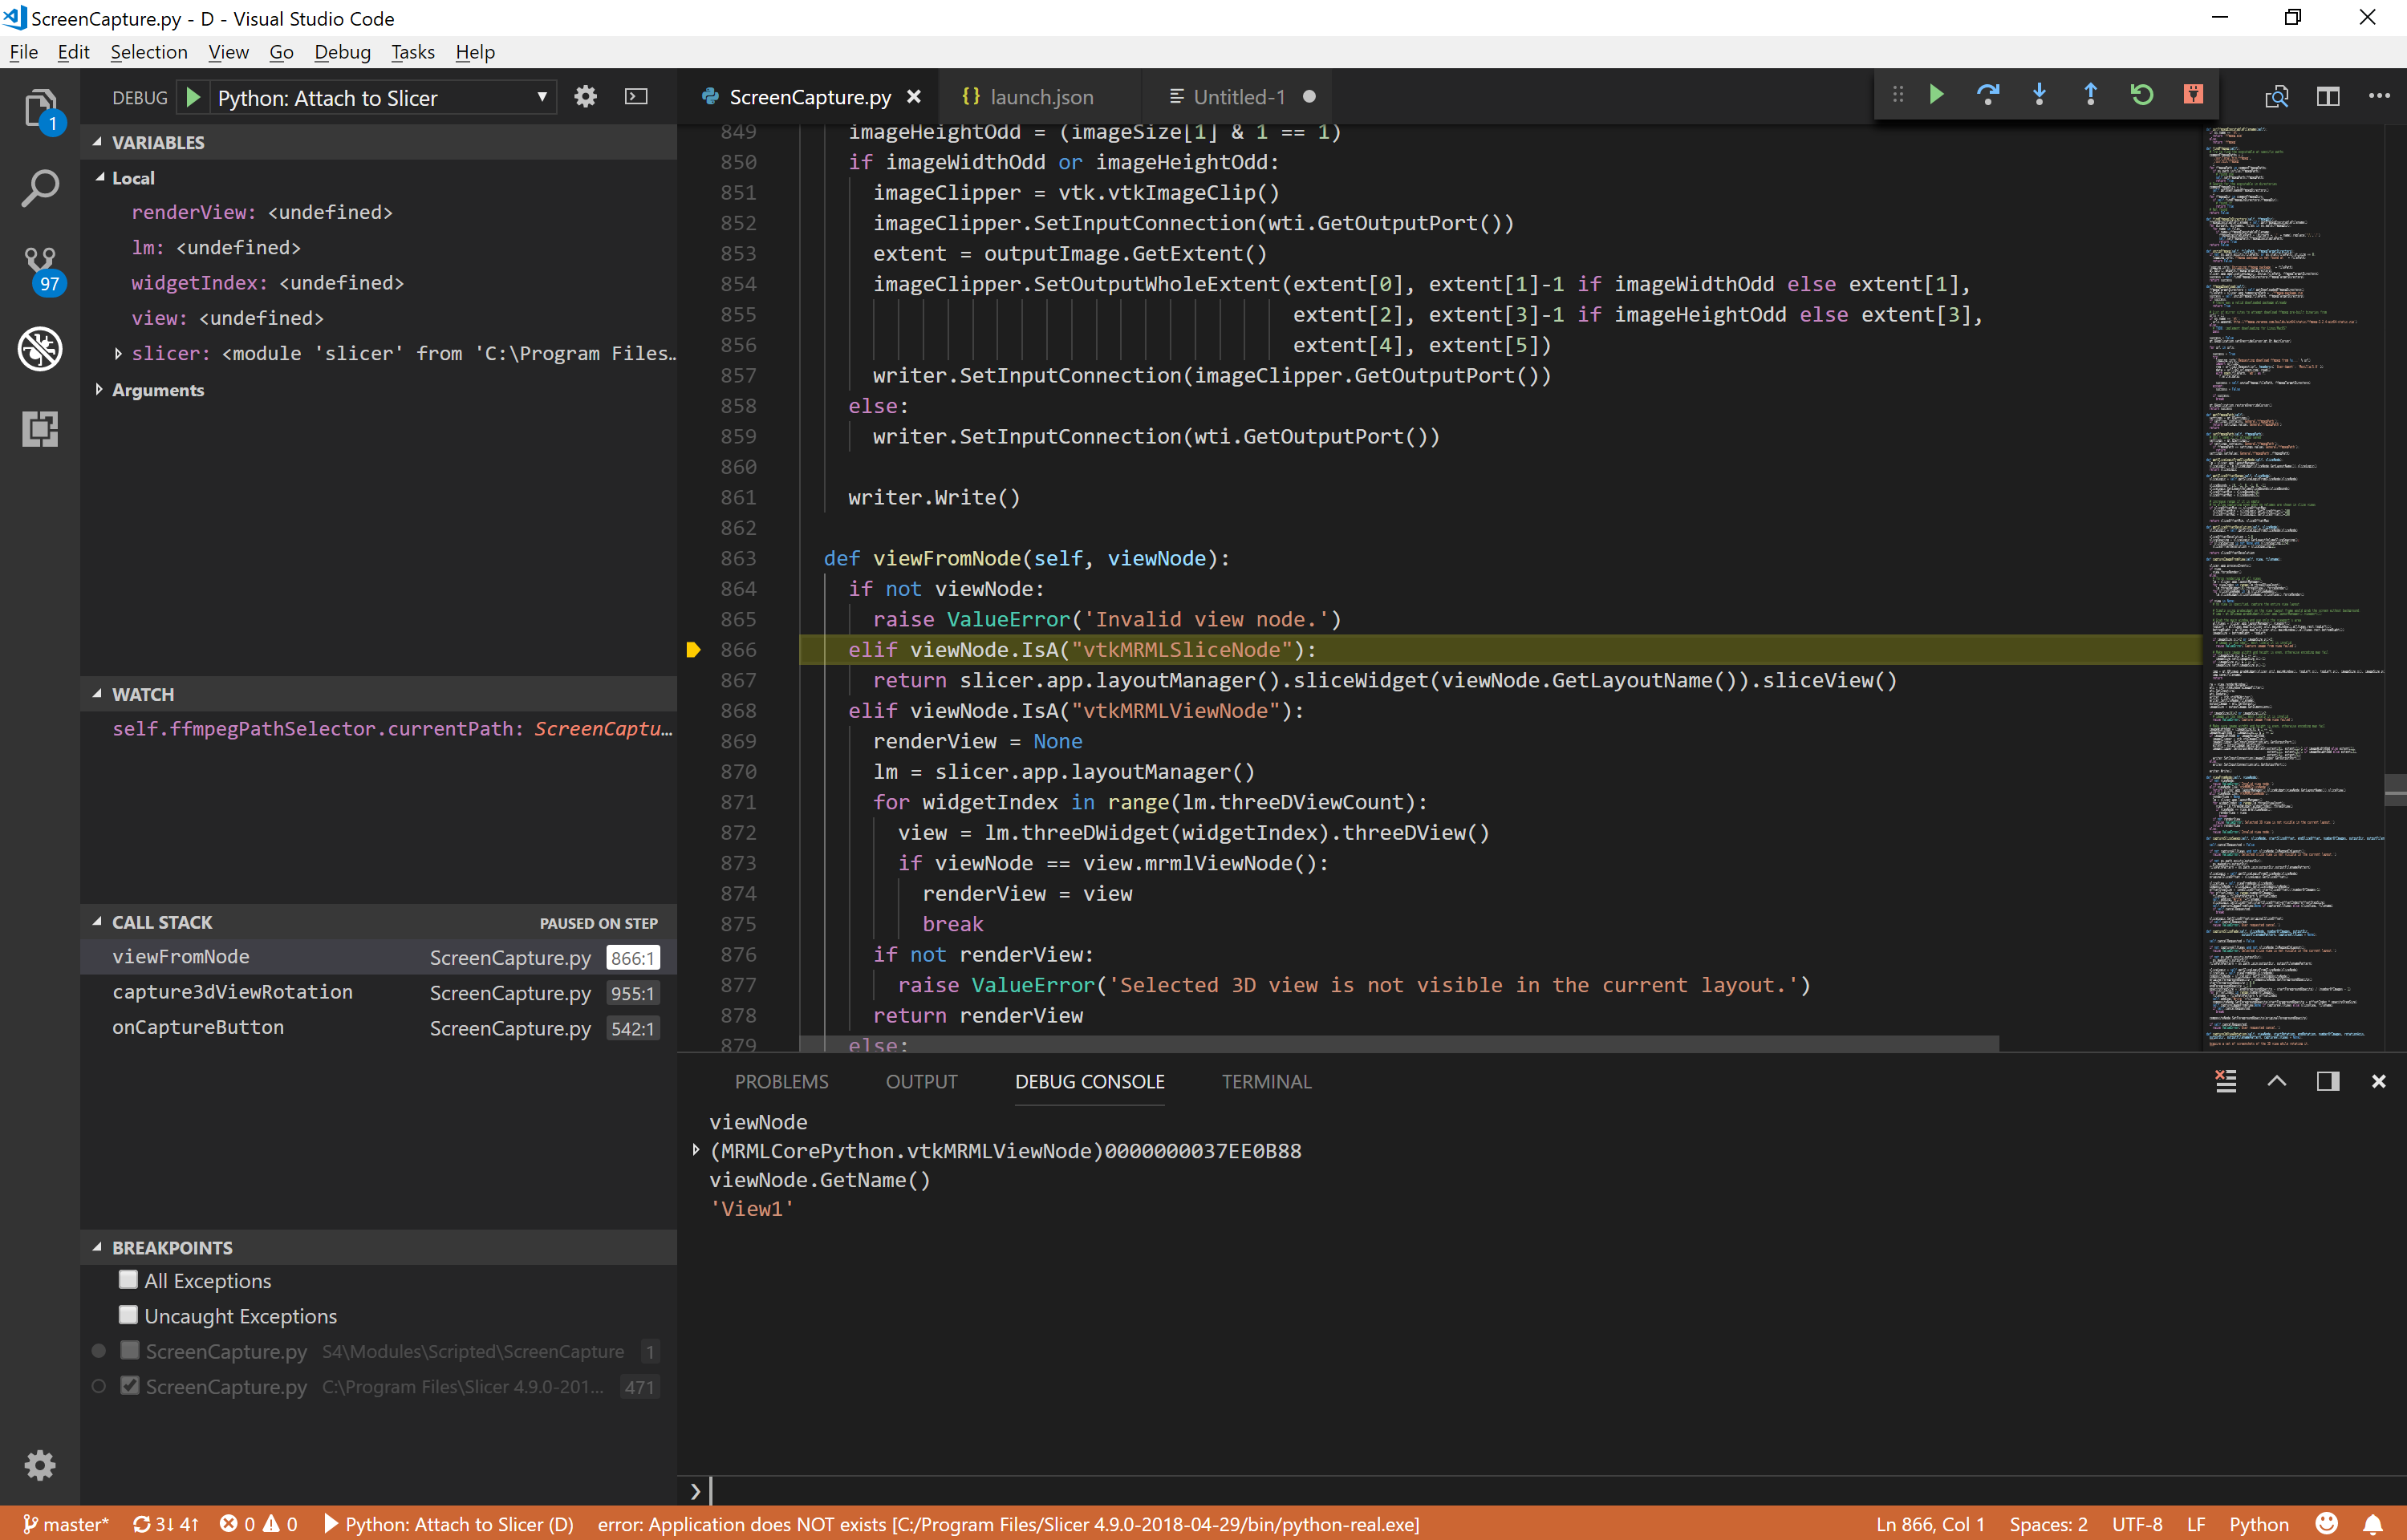
- Visual Studio Code: Same capabilities as in Visual Studio Code, but it is a bit more complicated to set up (need to open a workspace/folder, which unloads all edited files; need to edit a json file to configure the debugger configuration)
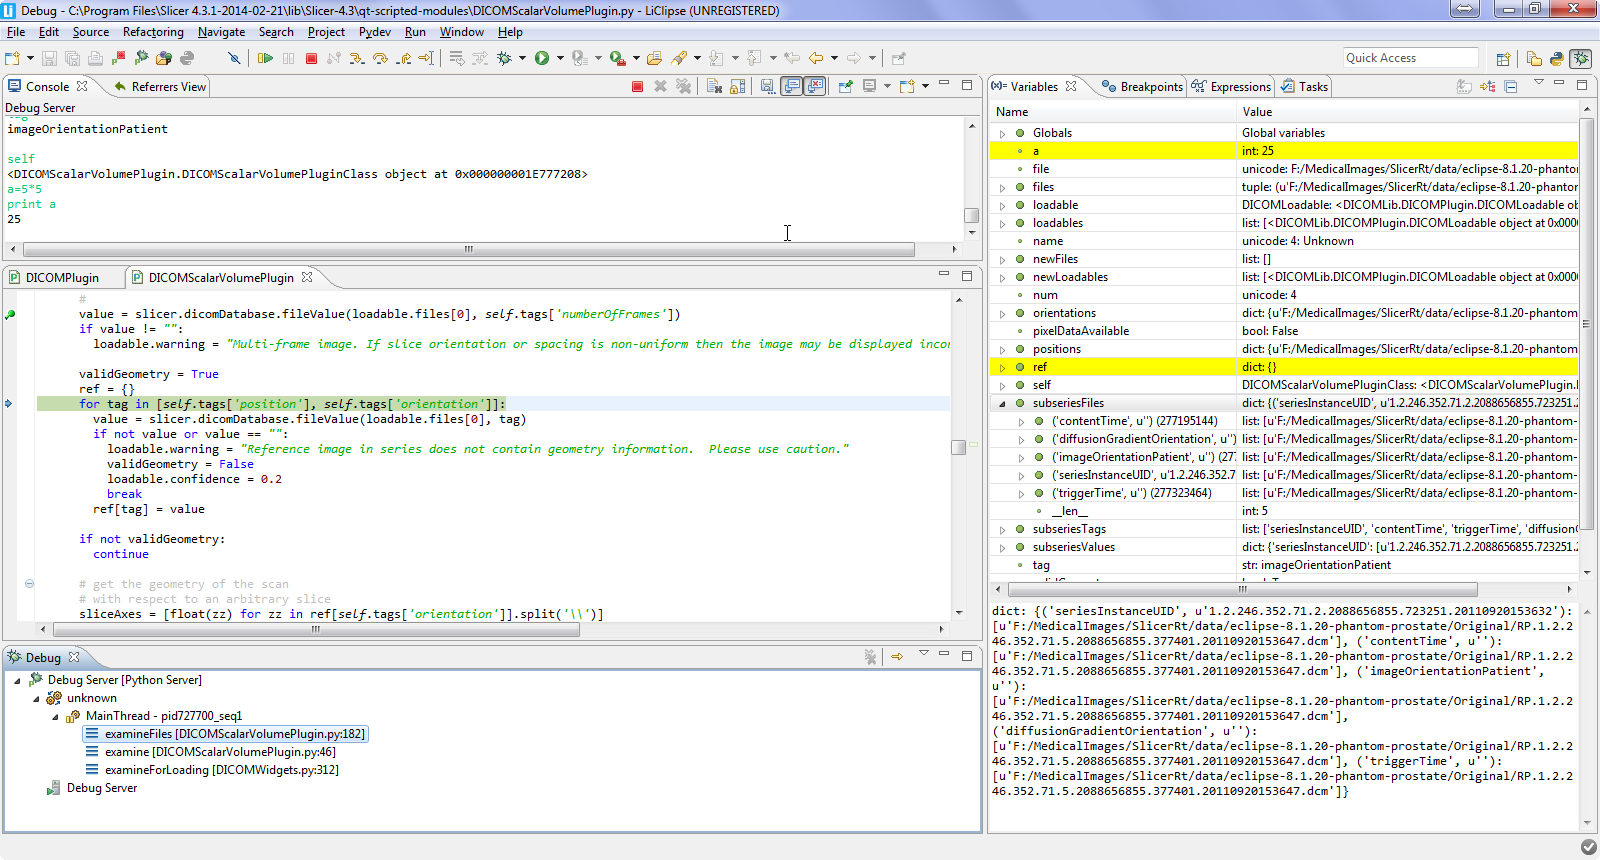
- Eclipse: Has less features than other editors and not as convenient, but has the unique feature of being able to jump to any line within the current function.
- Install Professional Edition of [PyCharm]](https://www.jetbrains.com/pycharm/download/). Professional version is avaialable for anybody with an academic email address for free. Free Community edition will not work, as it does not include remote debug server.
- In PyCharm:
- In the menu select:
Run/Edit configurations - Click the small + icon in the top-left (Add new configuration)
- Select
Python remote debug configurationorPython debug serveras template - Set Name:
Slicer remote debugger - Set Port:
5678 - Click OK
- In the menu select:
- In Slicer:
- Install the
DebuggingToolsextension - Open the
Python debuggermodule (inDeveloper Toolscategory) - In the
Settingssection select debugger:PyCharm - If
pycharm-debug.eggpath is not detected automatically then set the path with the selector (it is usually in thedebug-eggssubfolder of the PyCharm installation)
- Install the
- In PyCharm:
- In the menu select:
Run/Debug, clickSlicer remote debugger
- In the menu select:
- In Slicer:
- Open the
Python debuggermodule (inDeveloper Toolscategory) - Click on
Connectbutton. Slicer will become unresponsive until the debugger is attached.
- Open the
- In PyCharm:
- Load your .py file and add breakpoints (menu:
Run/Toggle Line Breakpoint) where you want your execution to stop for debugging. - Important: once Slicer is paused at a breakpoint, you can open a terminal, where you can enter Python commands. In that terminal you have access to all Slicer variables, it has auto-complete, etc. Click the small terminal icon
Show Python Promptto open the Python terminal.
- Load your .py file and add breakpoints (menu:
If attaching the debugger with "Connection refused" error message then:
- Make sure the debug server is started. It is indicated by PyCharm should displaying this message
Starting debug server at port 5678 ... Waiting for process connection - On Linux, make sure the 5678 port is enabled on the firewall by this command:
sudo ufw allow 5678
- Install Visual Studio Code (free, available on Windows, Linux, and Mac)
- Install
Pythonextension by Microsoft - Start Visual Studio Code and set up remote debugger connection to Slicer:
- Open a folder that contains your Python files by selecting in menu: File / Open folder
- Open a Python file
- Select in menu: Run / Add configuration
- Choose "Remote attach", use
localhostfor host name, and5678for port number - Visual Studio should show
launch.jsonfile that contains aPython: Remote Attachentry inconfigurationselement. RemovepathMappingssection (otherwise the debugger with fail to add breakpoints with the messagepydev debugger: warning: try to add breakpoint to file that does not exist). The resulting launch.json file should look something like this:
{
    // Use IntelliSense to learn about possible attributes.
    // Hover to view descriptions of existing attributes.
    // For more information, visit: https://go.microsoft.com/fwlink/?linkid=830387
    "version": "0.2.0",
    "configurations": [
        {
            "name": "Python: Remote Attach",
            "type": "python",
            "request": "attach",
            "port": 5678,
            "host": "localhost"
        }
    ]
}
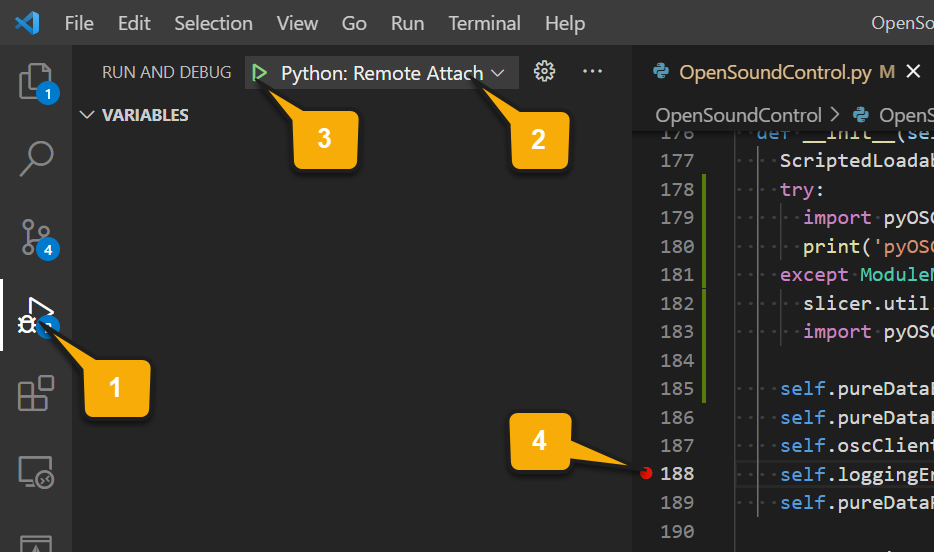
- Click the "Run and debug" icon in the left side of the screen (see
1in the screenshot below) - Choose
Python: Remote Attachconfiguration at the top of the debug panel (see2in the screenshot below). Do not click the green button yet (3in the screenshot below): connection will fail because the connection has not been initiated in Slicer yet.
- In Slicer:
- Install the
DebuggingToolsextension - Open the
Python debuggermodule (inDeveloper Toolscategory) - In
Settingssection select debugger:VisualStudio Code
- Install the
- In Slicer:
- Open the
Python debuggermodule (inDeveloper Toolscategory) - Click on
Connectbutton. Slicer will become unresponsive until the debugger is attached.
- Open the
- In Visual Studio Code:
- Click debugger icon on the left side of the screen (see
1in the screenshot above) - Click
Start debuggingbutton (green triangle, see3in the screenshot above) - Add a breakpoint to the Python file where you want to start debugging by clicking slightly to the left from the line number (a red dot will appear there, see
4in the screenshot above)
- Click debugger icon on the left side of the screen (see
- Install Eclipse with PyDev: the simplest is to use the standalone preconfigured LiClipse package.
- Run PyDev and enable the remote debugger tool (if you have trouble following these steps then you can find detailed instructions here.
- Enable PyDev server: in the menu
Window>Customize perspective>Command groups availability>PyDev debug - Open the debug window: in the menu
Window>Open Perspective>Other>Debug=> Without this step theResumebutton will be disabled and debugging cannot be started!
- Enable PyDev server: in the menu
- In Slicer:
- Install the Python debugger extension
- Open the
Python debuggermodule (inDeveloper Toolscategory) - In the
Settingssection set the directory that contains thepydevd.pyfile. Usually it is in the Eclipse plugins directory/...pydev.../pysrc.
- In PyDev
- Start the server: on the toolbar click the button "PyDev: start the pydev server"
- In Slicer:
- Open the
Python debuggermodule (inDeveloper Toolscategory) - Click on
Connect - If the debugger is successfully attached, then it will pause Slicer, so Slicer becomes unresponsive (until its execution is resumed in PyDev)
- Open the
- In PyDev:
- Slicer execution is now paused. Slicer will become unresponsive until the debugger is attached.
- Load your .py file into PyDev and add breakpoints (Ctrl+Shift+B) where you want your execution to stop for debugging.
- Important: you can open a terminal, where you can enter Python commands while the execution is paused (you have access to all Slicer variable, it has auto-complete, etc.) by clicking on
Open Console(small button at the top of the console view) then chosePyDev Consoleand thenPyDev Debug Console(after this the title of the console should bePyDev Debug Consoleinstead of the defaultDebug Server).
- Enable
Python developmentcomponent for Visual Studio (if has not been enabled already):- Start
Visual Studio Installerapplication - Click
Modifybutton of your Visual Studio configuration - Check the
Python developmentcheckbox
- Start
- In Slicer:
- Install the
DebuggingToolsextension - Open the
Python debuggermodule (inDeveloper Toolscategory) - In the
Settingssection select debugger:VisualStudio
- Install the
- In Slicer:
- Open the
Python debuggermodule (inDeveloper Toolscategory) - Click on
Connectbutton. Slicer will become unresponsive until the debugger is attached.
- Open the
- In Visual Studio:
- In menu, select
Debug > Attach to Process(Ctrl+Alt+P) to display theAttach to Processwindow Attach to->Python codeProcess->SlicerApp-real.exe- Press Enter (or click
Attachbutton). The popup window in Slicer should disappear. - For connecting again,
Debug > Reattach to Process(Shift+Alt+P) function can be used
- In menu, select


