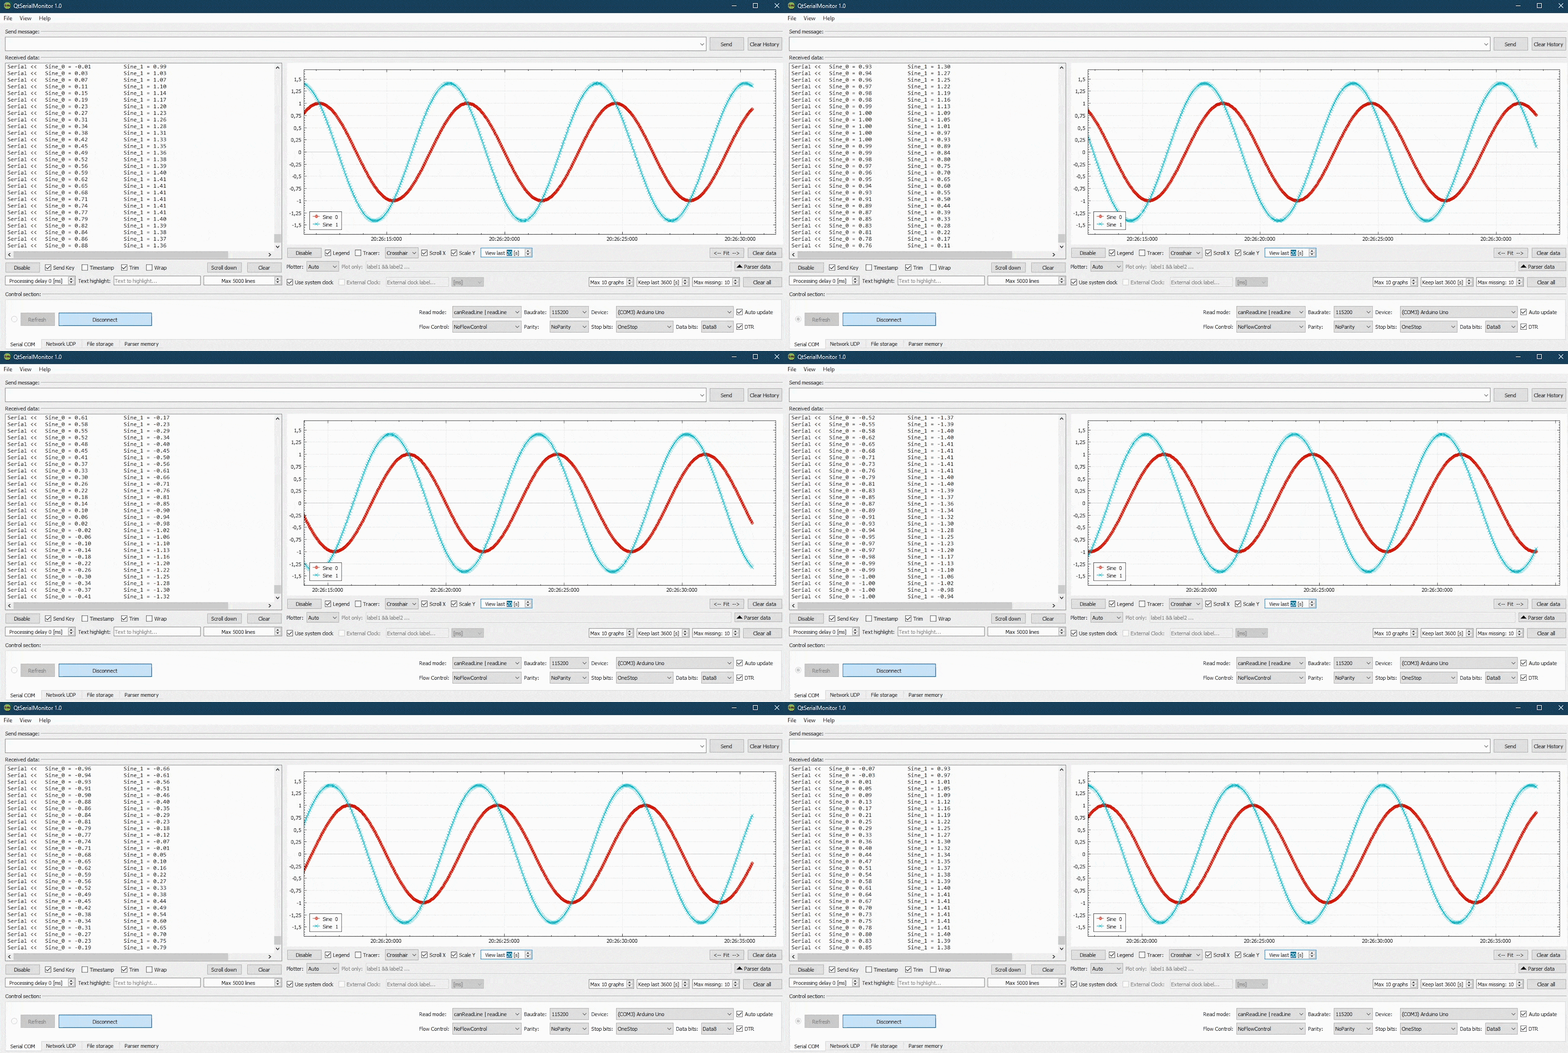
Universal serial monitor with data plotting capabilities, based on Qt. Designed with all sorts of Arduino projects in mind, as a handy tool for debugging and experimentation :)
Features:
- In/out serial data terminal with command history,
- UDP network protocol support,
- Resizable UI widgets,
- Data plotter with multiple graphs support and basic data filtering - uses QCustomPlot,
- Printer support, ability to save graph as image,
- Read/write ".csv", ".txt" data logs,
- many more...
Work in progress:
- 3D Orientation Demo - for IMU testing (user will be able to toggle between chart view
  and a simple 3D scene containing an object rotating accordingly to received roll,
  pitch and yaw values, representing the sensor's orientation),

- Improvements, fixes etc.
Notes:
-
The app uses a custom-written parser, which searches the incoming message for plottable data in form of label-value set. At the moment, all labels and values must be separated with a whitespace in order to be recognized. Its possible to use separators like "=" and "," - parser will be replace them with whitespace before processing. If no label is found, a generic name will be used i.e. "Graph 0".*
Examples of supported formats: - "Roll = 1.23 Pitch = 45.6" - "Voltage: 1.23 (tabulator) Output: 4.56" - "1.23 4.56" (Graph 0 and Graph 1) -
Application uses QtSettings functionality and stores a simple .ini file on the hard drive in which it keeps its settings. Under Windows, the file should be located in C:\ProgramData\QtSerialMonitor. The settings are saved each time the app closes.


