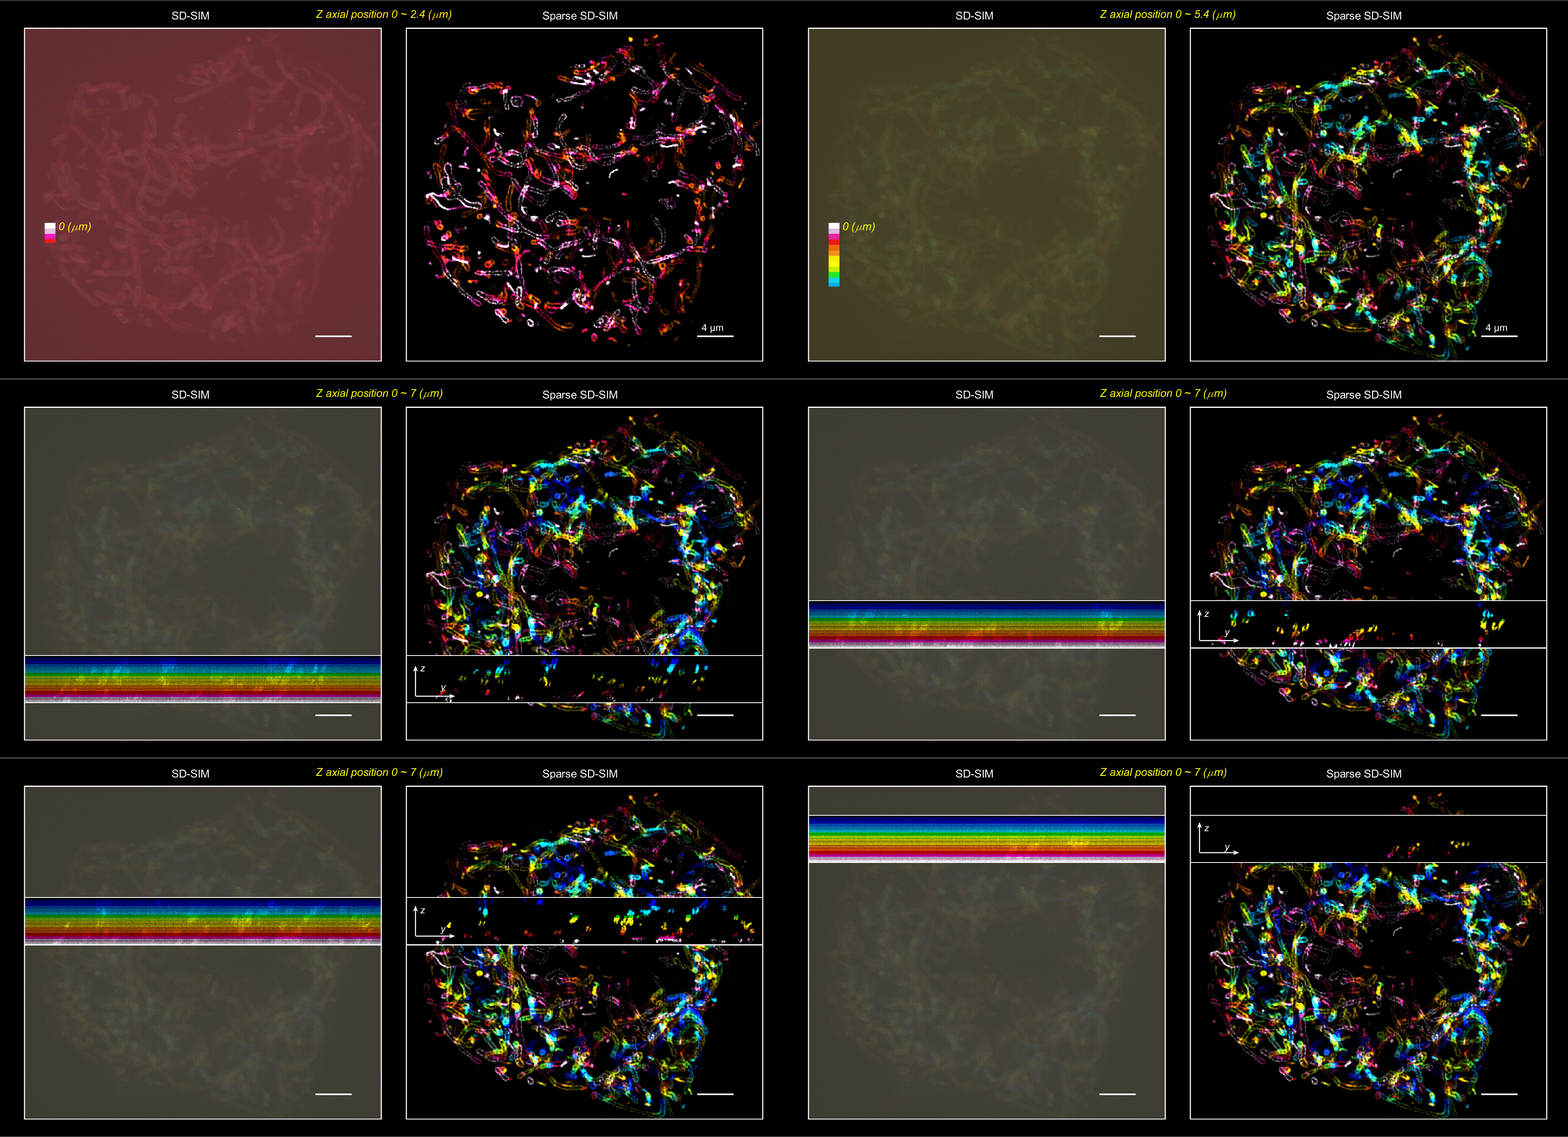
It contains the source-code to generate the videos in the publication:
If you find img2vid useful, please cite our paper.
v0.1
- Load your exsiting images (captured with your camera or PMT) into memory:
imreadRGBTiffimreadTiff - Process the images as your design:
curtainradarcolormscalebaredgingframeimlargeappendtappendxyMergetifresize
Attention! The most important thing to create a video with
img2vidis the concept of canvas. Specifically, before process the images, you should plan the canvas size of your video e.g.zeros(2000,4000,3). Once the canvas is settled, all left is to draw (fill in) your canvas with your designed content.
- Save your results:
imwriteRGBstackimwritestack - Print the label to the processed images.
- Make the videos!
draw_gifdraw_avi
- Radar special effect
- imagejROI2Matlab from @DylanMuir
- imagej Animated Panning/Zoom in from @cleterrier with some modifications
- imagej ROI zoom in from @ekatrukha
- Basic features
- curtain.m: to creat the curtain-like special effect (comparison between multi-image).
/example1
rate=5;
data1=before;
data2{1}=after1;
data2{2}=after3;
img=curtain(data1,data2,rate)

/example2
data1=before;
data2=after;
img=curtain(data1,data2,rate)

/example3
for i=1:3
	data1=before(:,:,i);
	data2=after(:,:,i);
	img(:,:,i,:)=curtain(data1,data2,rate)
end- radar.m: to creat the radar-like special effect (comparison between 2 images).
/example1
rate=5;
isRGB=1;
linewidth=1;
out = radar(data1,data2,rate,isRGB,linewidth);

/example2
rate=5;
isRGB=0;
linewidth=1;
outRGB = radar(data1,data2,rate,isRGB,linewidth);
out=squeeze(outRGB(:,:,1,:));- colorm.m: to creat the color-coded special effect (t or z axial projection). The common colormap jet and 16_colors is provided in this repo.
large=zeros(975+130,1042*2+200,3);
jet=double(imread('16_colors.tif'));
Mito=3*SHMito;
Mito=edging(Mito,3);
Mito=scalebar(Mito,950,953,750,855);
Tubulin=scalebar(Tubulin,950,953,750,855);
Mito2=2*SIMMito;
Mito2=edging(Mito2,3);
Mito=colorm(Mito,jet);
Mito2=colorm(Mito2,jet);
flage=0;
for i=141:-1:1
    large=zeros(975+130,1042*2+200,3);
    flage=flage+1;
    mid=sum(Mito(:,:,:,i:140),4);
    mid=mid./max(mid(:));
    mid=edging(mid,3);
    mid=scalebar(mid,900,903,850,955);
    large(81:80+975,71:70+1042,:)=mid;
    mid=sum(Mito2(:,:,:,i:140),4);
    mid=10*mid./max(mid(:));
    mid=edging(mid,3);
    mid=scalebar(mid,900,903,850,955);
    large(81:80+975,141+1042:140+1042*2,:)=mid;
    large(651:650+size(ceil(i*256/120):256,2),131:162,1)=jet(:,256:-1:ceil(i*256/120),1)'/255;
    large(651:650+size(ceil(i*256/120):256,2),131:162,2)=jet(:,256:-1:ceil(i*256/120),2)'/255;
    large(651:650+size(ceil(i*256/120):256,2),131:162,3)=jet(:,256:-1:ceil(i*256/120),3)'/255;
    imwrite(large,['stage1\',int2str(flage),'.tif']);
end- imlarge.m: Interestingly, if you have a small image (for example 50x50) and want to display it in large, the interpolation (if over 2 times) will make such image looks very blurry or oversmooth. This function will enlarge each pixel without interpolation to solve this problem.
large=imlarge(imgsmall,20);- draw_avi.m: You can DIY your specific video rate with a maximal rate.
function draw_avi(display,filename,mag,Quality)
if nargin < 3 || isempty(mag)
    mag=1;
end
if nargin < 4 || isempty(Quality)
    Quality=100;
end
vid = VideoWriter(filename,'MPEG-4');
% vid = VideoWriter(filename,'Uncompressed AVI');
vid.Quality = Quality;
vid.FrameRate=30;
open(vid)
for i = 1 : 141
    for loop2=1:2
        imshow(display(:,:,:,i),'border','tight','initialmagnification','fit')
        set (gcf,'Position',[0,0,mag*size(display(:,:,i),2),mag*size(display(:,:,i),1)])
        axis normal
        drawnow;
        c = getframe;
        writeVideo(vid, c);
    end
end
for i = 141 : 141
    for loop2=1:60
        imshow(display(:,:,:,i),'border','tight','initialmagnification','fit')
        set (gcf,'Position',[0,0,mag*size(display(:,:,i),2),mag*size(display(:,:,i),1)])
        axis normal
        drawnow;
        c = getframe;
        writeVideo(vid, c);
    end
end
close(vid)for i=142:349
figure(1)
flage=flage+1;
large=imread(['stage1\',int2str(i),'.tif']);
imshow(large,'border','tight','initialmagnification','fit')
set (gcf,'Position',[0,0,1*size(large,2),1*size(large,1)])
text1=text(920,40,['\it{Z axial position 0 ~ }',num2str(roundn((140)*(0.05),-2)),' (\mu\it{m})']);
set(text1,'Color',[1,1, 0],'Fontsize',20,'Fontname','Arial')
text1=text(500,45,['label1']);
set(text1,'Color',[1,1,0.99],'Fontsize',20,'Fontname','Arial')
text1=text(1580,45,['label 2']);
set(text1,'Color',[1,1,0.99],'Fontsize',20,'Fontname','Arial')
text1=text(1284,1005-(i-142)*4,['\it{y}']);
set(text1,'Color',[1,1,0.99],'Fontsize',18,'Fontname','Arial')
text1=text(1224,951-(i-142)*4,['\it{z}']);
set(text1,'Color',[1,1,0.99],'Fontsize',18,'Fontname','Arial')
annotation(gcf,'arrow',[0.53 0.53],...
[0.097+(0.0034)*(i-142) 0.17+(0.0034)*(i-142)],'Color',[1 1 1],'LineWidth',2);
annotation(gcf,'arrow',[0.53 0.58],...
[0.096+(0.0034)*(i-142), 0.096+(0.0034)*(i-142)],'Color',[1 1 1],'LineWidth',2);
export_fig(gcf,['stage2\',int2str(flage),'total.png'])
end
for i=517:543
figure(1)
flage=flage+1;
large=imread(['stage1\',int2str(i),'.tif']);
imshow(large,'border','tight','initialmagnification','fit')
set (gcf,'Position',[0,0,1*size(large,2),1*size(large,1)])
text1=text(230,505,['label1']);
set(text1,'Color',[1,0,0],'Fontsize',25,'Fontname','Arial')
text1=text(280,545,['+']);
set(text1,'Color',[1,1,1],'Fontsize',25,'Fontname','Arial')
text1=text(170,585,['label2']);
set(text1,'Color',[0,1,0],'Fontsize',25,'Fontname','Arial')
export_fig(gcf,['stage2\',int2str(flage),'total.png'])
endframeaims to draw a rectangle ROI in the large field of view.appendtandappendxyaim to append frames along different axes.Mergeandtifresizeaim to append frames with different xy size along t axial.saclebaraims to draw a scale bar.edgingaims to draw white boxes on the edge of images.
- To produce a large number of videos (for publications), the speed of scripts will be much much faster than the
Adobe Premieretype UI software. You may spend a little time on your first video, but with the accumulated code snippets, this will speed up much on your second video. - To produce the data e.g., enlarge/merge channels/curtain/scale bar/auto-label, scripts are faster, and more flexible than
Adobe Premiere. - In fact, in my opinion, the best way is to combine these tools, e.g., produce data with matlab scripts, and make videos with
Adobe Premiere. But you may want to avoid twice video label production, which will leave to different label resolution.
- Certainly, python is also a good choice to produce the videos, and it is in the plan to add a pyhon version of
img2vid. - However, if you want to label a rectangle or an arrow on your videos, you will need the
matlab fig UIto locate the specific position and angle of them. Additionally, in my usage, the images/videos/gif labeled and produced with python are usually with low resolution. - Matlab is an integrated environment. For python, you have to find some effective packages yourself to produce the label, and high resolution images/videos/gifs.
export_fig, Zoom in ROI, and Palette
You can find documents through the links! Also img2vid is accompanied with some imagej macro from @HenriquesLab and @cleterrier.
BTW, if you want to merge a multi-channel 2D or 3D (to MIP view) images, you can have a try on Palette. Palette enables users to ‘fine tune’ each merged color (exact weights of RGB components assembling, gamma, and gain setting for each channel).
Open source img2vid
This program is free software: you can redistribute it and/or modify it under the terms of the GNU General Public License as published by the Free Software Foundation, either version 3 of the License, or (at your option) any later version. This program is distributed in the hope that it will be useful, but WITHOUT ANY WARRANTY; without even the implied warranty of MERCHANTABILITY or FITNESS FOR A PARTICULAR PURPOSE. See the GNU General Public License for more details.


