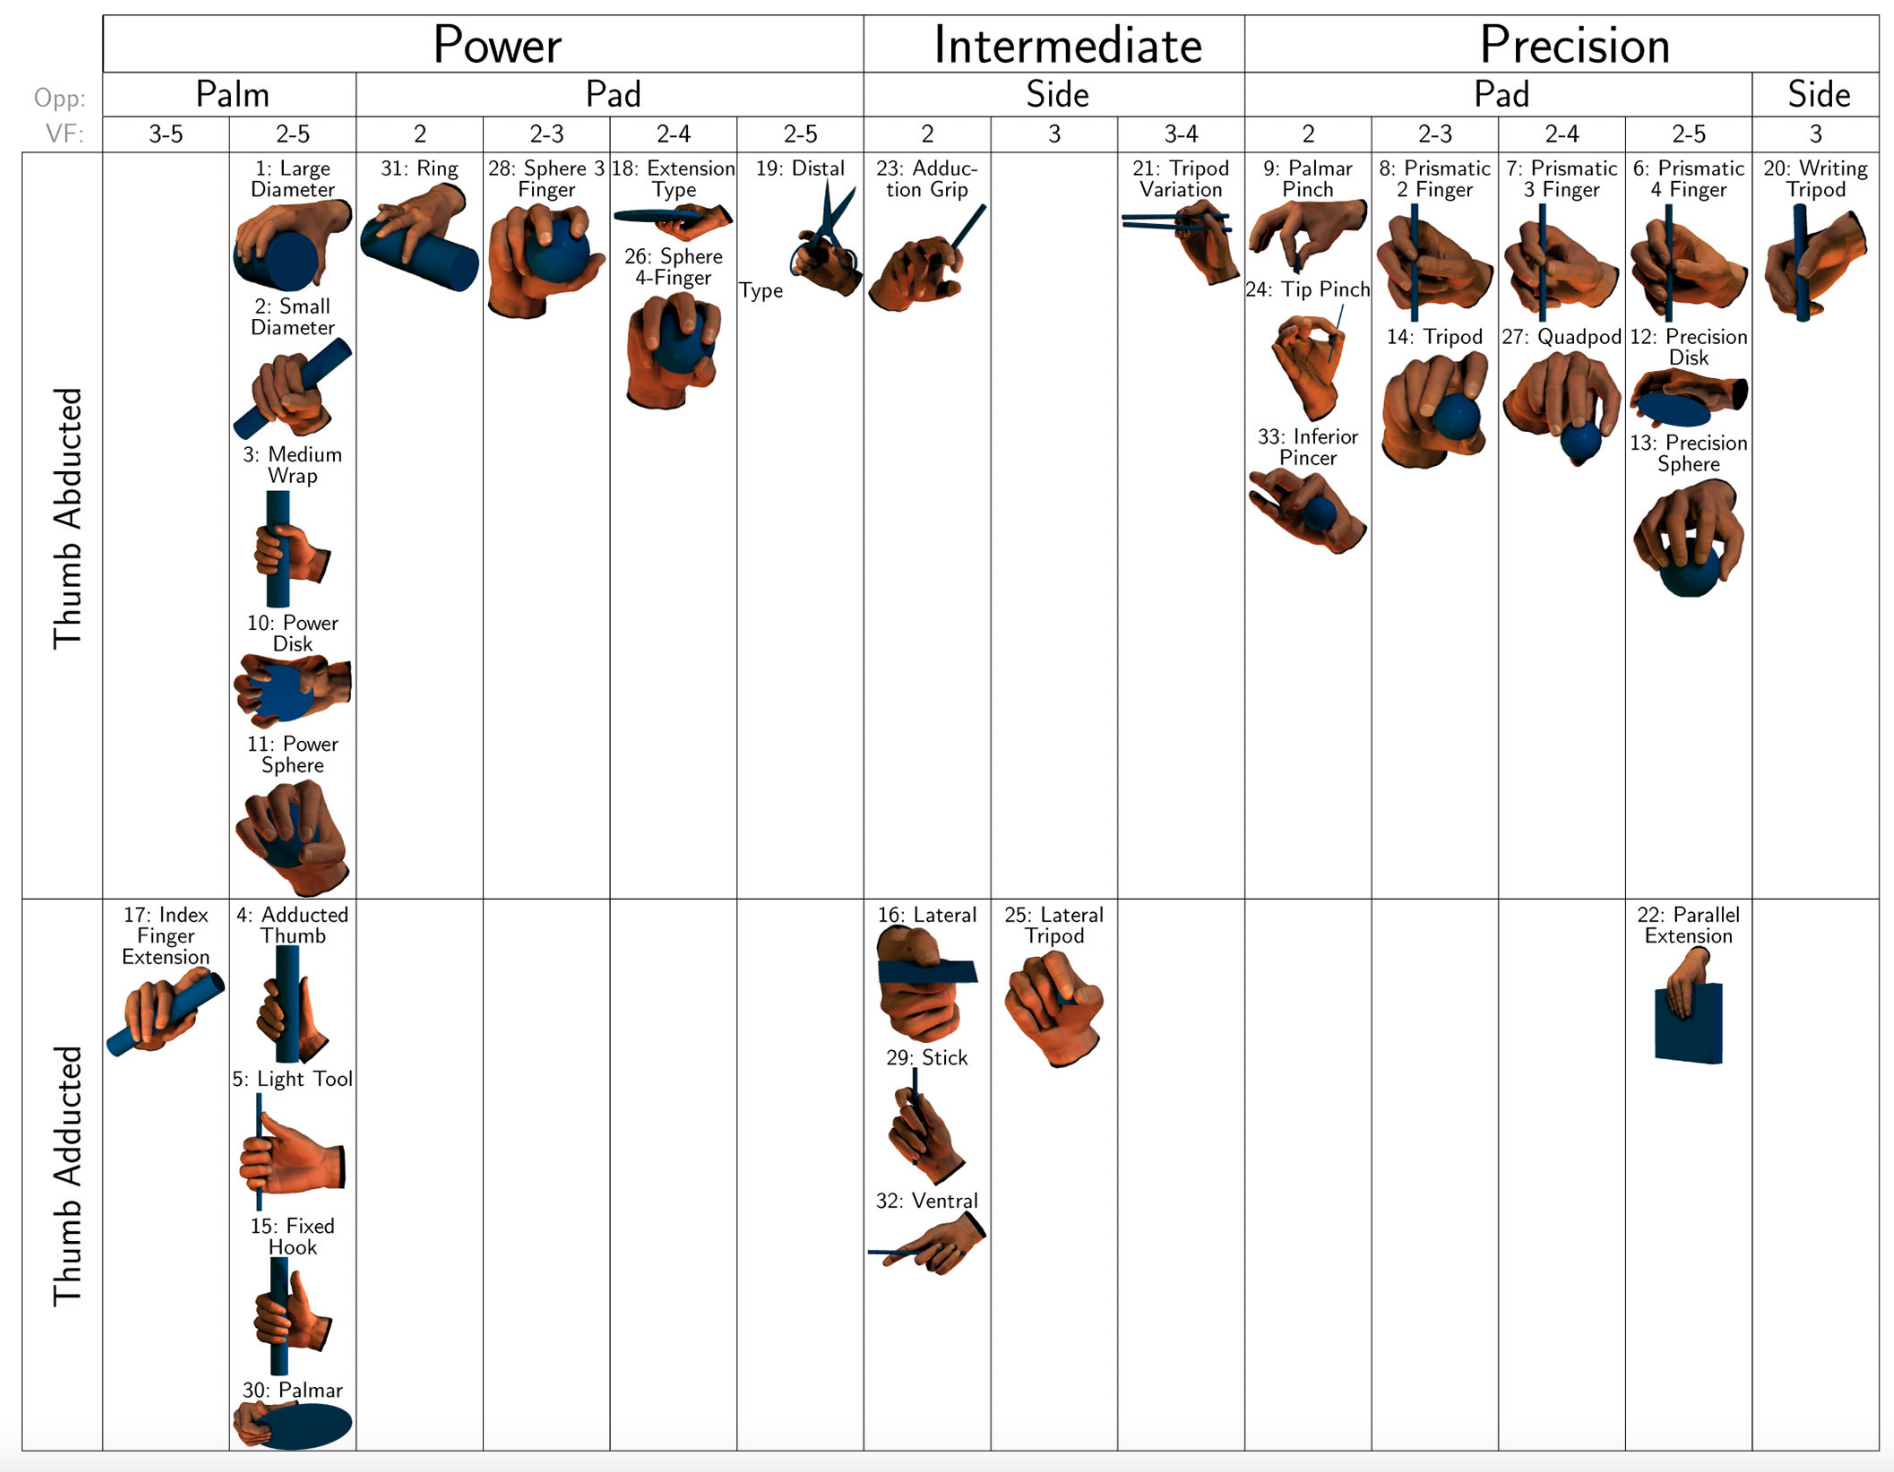
According to The GRASP Taxonomy of Human Grasp Types, there are 33 types of human grasps:
However, it is difficult to classify grasps for a dexterous hand (e.g. Shadow Hand, Allegro, etc) barely by its q-pose and contact points. To enable more efficient manual annotation of grasp type, we design this project.
You need to visualize all your grasps with HTML. It's recommended to use plotly.graph_objects. When the files are ready, put them in grasps/. You also need to modify grasps/grasps.json, where you put the HTML files' paths (relative to grasp/). Here's an example:
[
    "allegro/4a3ebf2c-f2c2-4617-a6b5-756b3a383f8a.html"
    "shadowhand/0cdda9d9-330c-4163-88e2-7c4ad9bcf2b6.html",
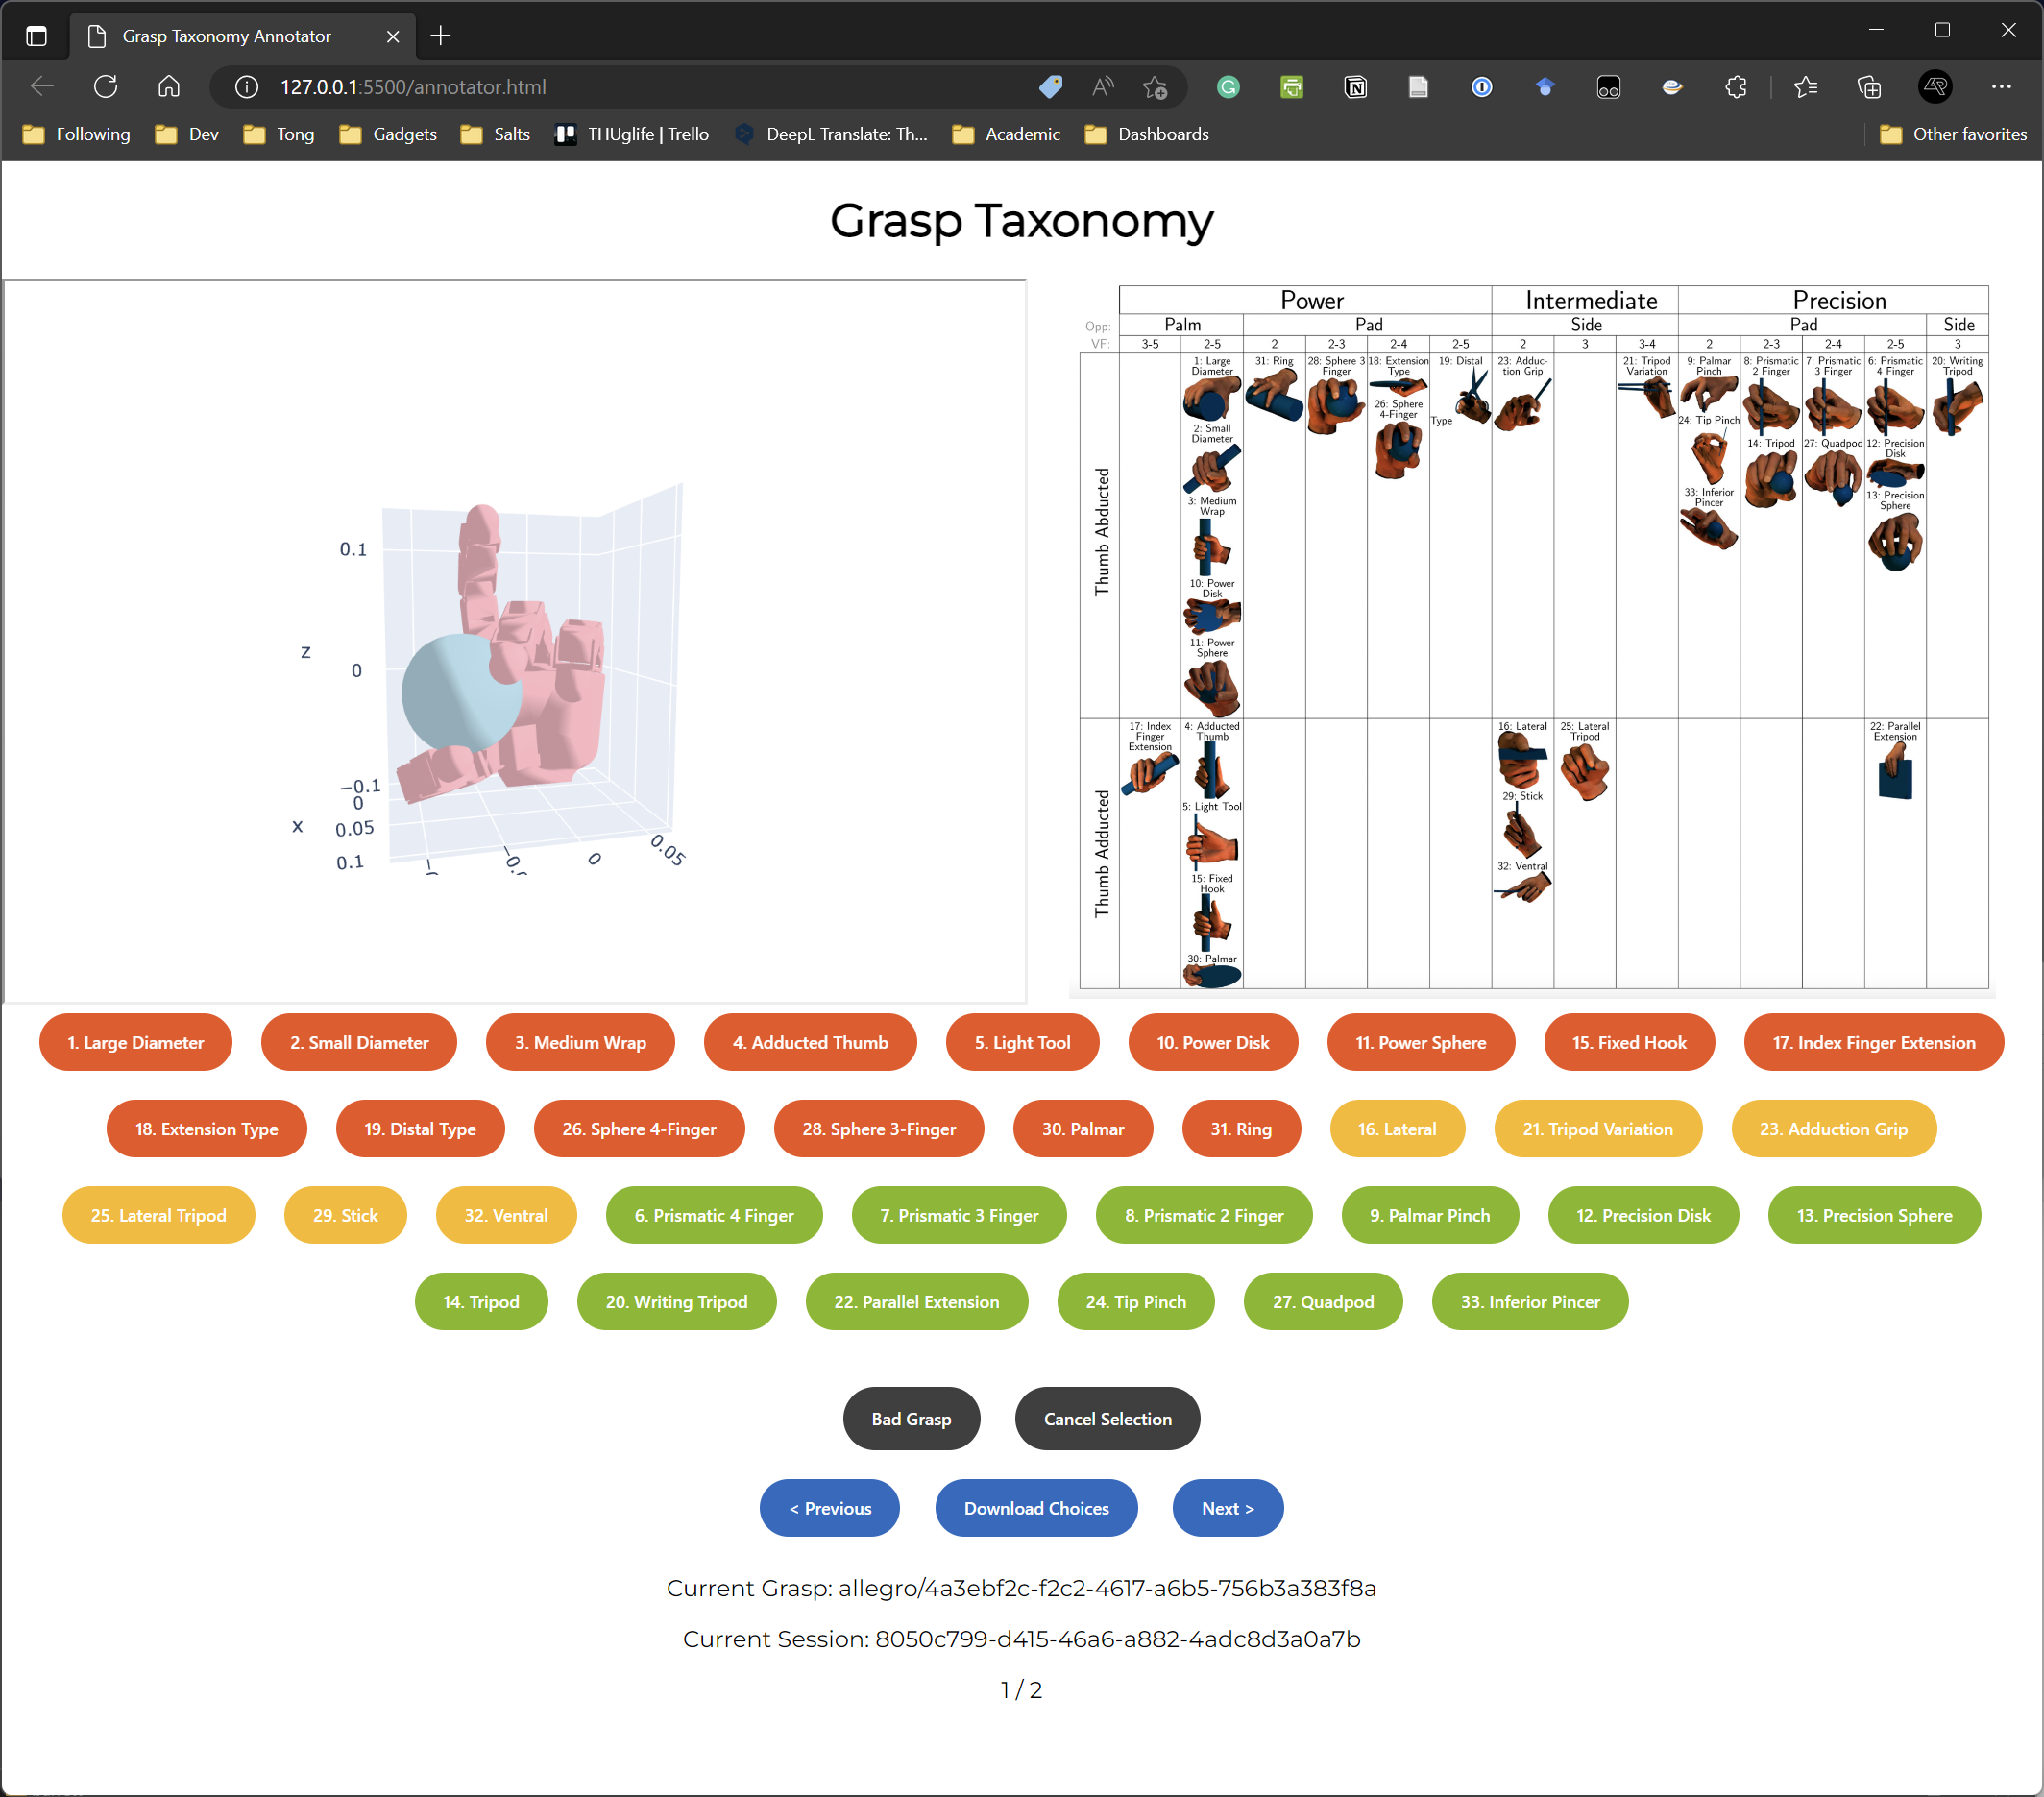
]Open annotator.html with a browser. You can see the main page of the annotator:
I'd like to introduce the information at the buttom, which shows:
- Grasp id (filename without extension) for the grasp
- Session id (to identify you and the JSON you download)
- Your selection for the current grasp (if selected)
The interactive HTML show on the left shows you the grasp, while the image on the right shows the 33 grasp types. For each grasp, you can:
- Choose a type according to your opinion by clicking on the corresponding button.
- Red button indicates a power grasp type
- Yellow button indicates an intermediate grasp type
- Green button indicates a precision grasp type
- Report a bad grasp by clicking the Bad Grasp
- Cancel your selection by clicking the Cancel Selection
Note that once you make your decision, the page will automatically change to the next grasp. You can rewind back with the Previous button.
With the blue buttons, you can:
- Download your choices as a JSON file by clicking the Download Choices button
- The file name will be
YOUR_SESSION_ID.json
- The file name will be
- Load the next grasp by the Previous and Next Button
Put all the downloaded JSON files (from multiple sources) in data\choices\raw. Then, to visualize selections, run
python show_choices.pyIt will plot the taxonomy choices.
I'd like to thank the New Bing for helping me writing some code.
The example in the image is for reference only.
If you'd like to optimize the webpage, please feel free contacting me!


