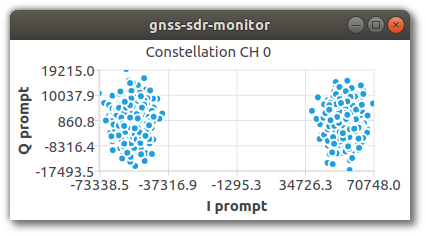
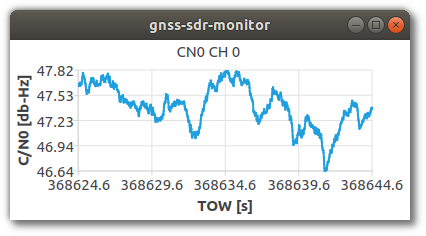
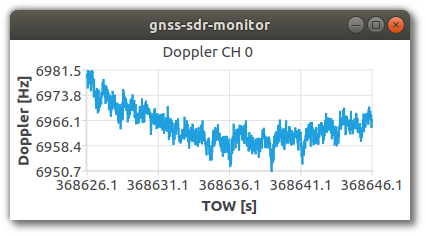
Welcome to gnss-sdr-monitor!
This program is a graphical user interface developed with Qt for monitoring the status of GNSS-SDR in real time.
 |
 |
 |
This GUI is designed to receive real-time data from GNSS-SDR over the network either locally (GNSS-SDR and GUI instances running on the same machine) or remotely (GNSS-SDR and GUI instances running on different machines).
The data that is required by the GUI to work comes from GNSS-SDR via two serialization streams over UDP: the Monitor block streaming and the PVT block streaming, which are independent from each other and provide different kinds of information. In addition, the GUI provides a widget for communicating with the receiver interactive interface (Telecommand via TCP/IP) by allowing you to send special commands to GNSS-SDR.
 Figure: GNSS-SDR general block diagram from the documentation page: https://gnss-sdr.org/docs/sp-blocks/. The Monitor block streaming and PVT block streaming are highlighted in red. The Telecommand module is highlighted in green.
Therefore, if you want to use the GUI, it is essential that at least you activate both serialization data streams in your GNSS-SDR receiver configuration file by following these instructions:
In your configuration file, append the following lines to the #PVT CONFIG# section. Put the IP address of the machine where the GUI is running and choose a port number at your own discretion. I am using the loopback address and port 1111 as an example.
PVT.enable_monitor=true
PVT.monitor_client_addresses=127.0.0.1
PVT.monitor_udp_port=1111
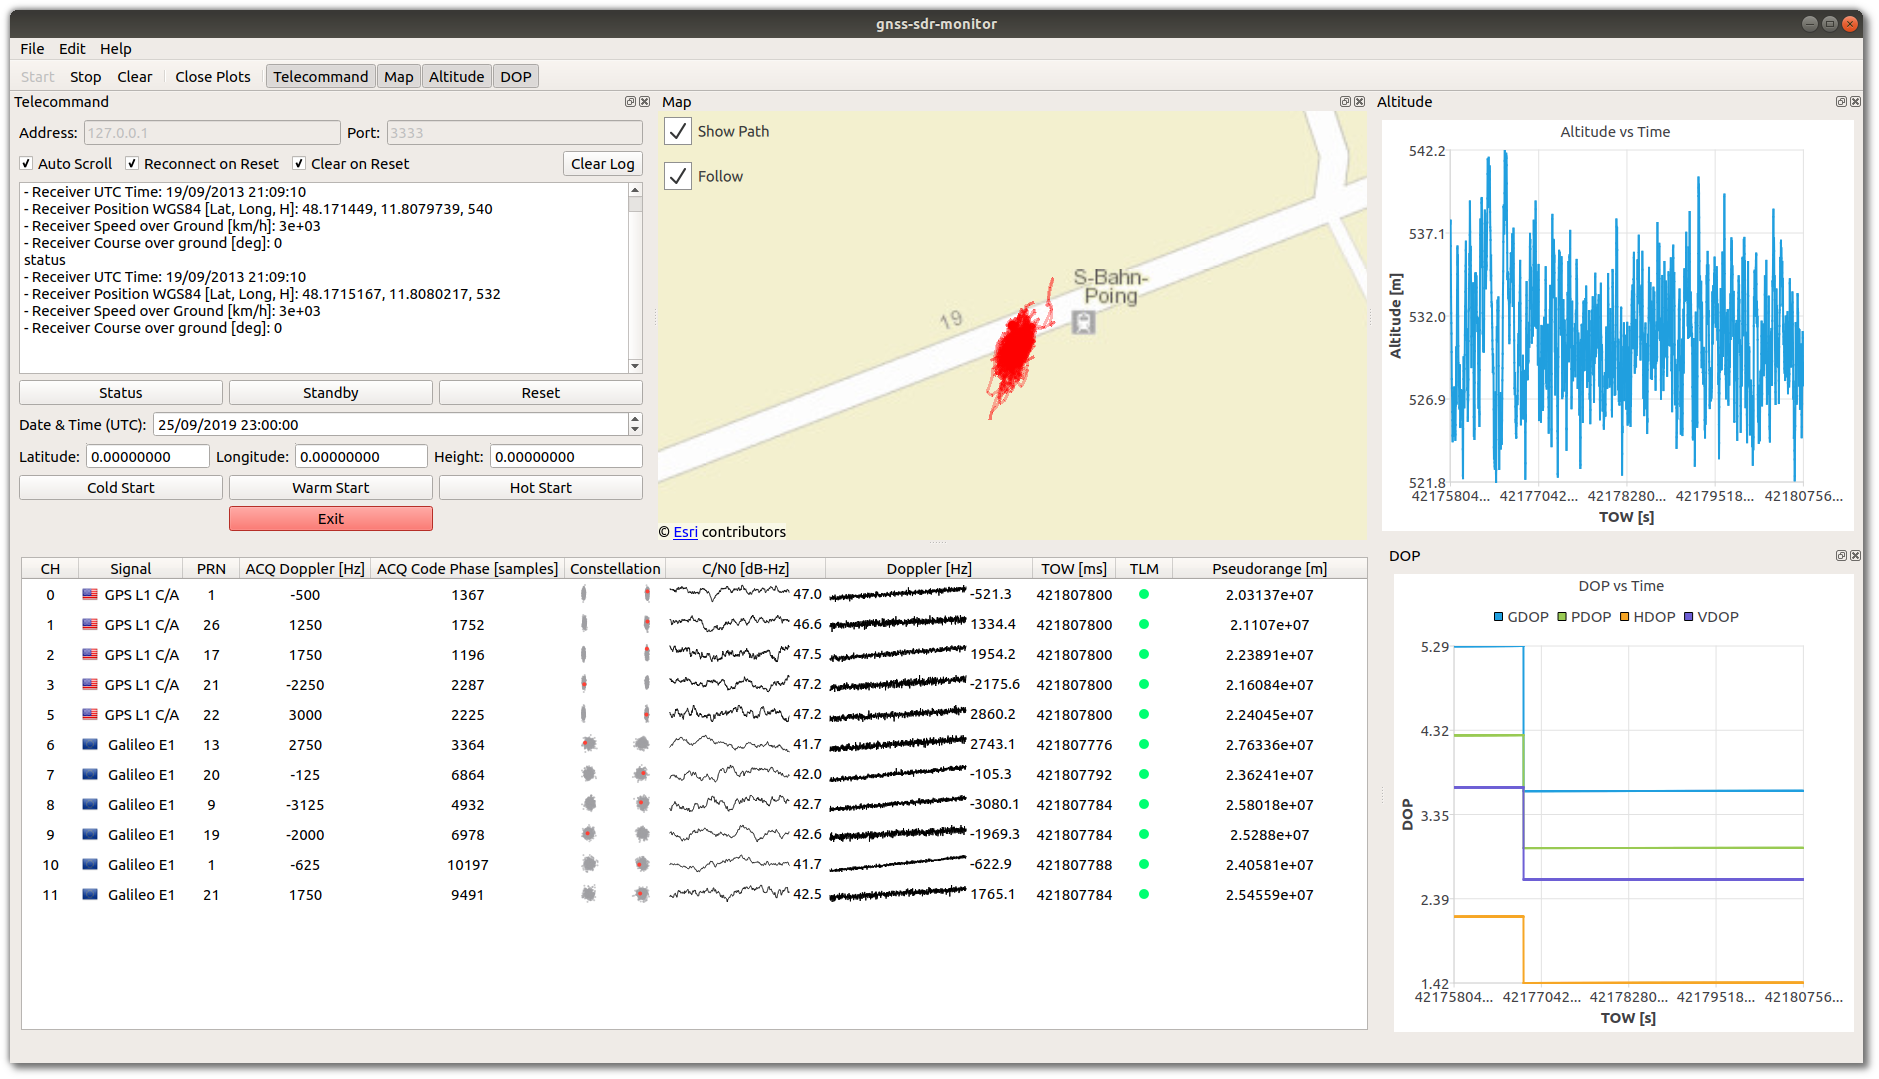
This will activate the serialized stream of PVT data to the GUI, which will let you see the position reported by the receiver on a live map as well as a charts of the reported altitude and dilution of precision.
Next, add the following chunk in the #MONITOR CONFIG# section. Again, choose the IP address of the machine where the GUI is running and a port number that work best for you.
Monitor.enable_monitor=true
Monitor.decimation_factor=1
Monitor.client_addresses=127.0.0.1
Monitor.udp_port=1112
This will activate the serialized stream of data from the Monitor block to the GUI, which will let you see a table-like widget with the status of each channel accompanied by data readings of the acquisition and tracking stages.
Making sure that the GUI setup matches that of the GNSS-SDR configuration file is a critical step for the connection to work. In the menu bar of the GUI go to Edit > Preferences, and verify that the port numbers are correct.
Finally, if you want to make use of the Telecommand functionality (which is something I would recommend), append the following lines to the #GLOBAL OPTIONS# section of the configuration file.
GNSS-SDR.telecommand_enabled=true
GNSS-SDR.telecommand_tcp_port=3333
And then enter the IP address and TCP port number in the widget.
This will let you send commands to control the GNSS-SDR instance that you are monitoring with the GUI.
Once you complete these steps you are all set.
If you are using Debian 10, Ubuntu 18.04 or above, this can be done by copying and pasting the following line in a terminal:
$ sudo apt install build-essential cmake git libboost-dev libboost-system-dev \
       libprotobuf-dev protobuf-compiler qtbase5-dev qtdeclarative5-dev qtpositioning5-dev \
       libqt5charts5-dev qml-module-qtquick2 qml-module-qtquick-controls2 qml-module-qtquick-window2 \
       qml-module-qtlocation qml-module-qtpositioning qml-module-qtquick-layouts
Once you have installed these packages, you can jump directly to download the source code and build gnss-sdr-monitor.
If you are using Arch Linux:
$ pacman -S gcc make cmake git boost boost-libs protobuf qt5-base qt5-declarative qt5-location \
       qt5-charts qt5-quickcontrols2
Once you have installed these packages, you can jump directly to download the source code and build gnss-sdr-monitor.
If you are using CentOS 7, you can install the dependencies via Extra Packages for Enterprise Linux (EPEL):
$ sudo yum install wget
$ wget https://dl.fedoraproject.org/pub/epel/epel-release-latest-7.noarch.rpm
$ sudo rpm -Uvh epel-release-latest-7.noarch.rpm
$ sudo yum install gcc-c++ make cmake git boost-devel protobuf-devel protobuf-compiler \
       qt5-qtbase-devel qt5-qtdeclarative-devel qt5-qtlocation-devel qt5-qtcharts-devel \
       qt5-qtdeclarative-devel
Once you have installed these packages, you can jump directly to download the source code and build gnss-sdr-monitor.
If you are using Fedora 28 or above, the required software dependencies can be installed by doing:
$ sudo dnf install gcc-c++ make cmake git boost-devel protobuf-devel protobuf-compiler \
       qt5-qtbase-devel qt5-qtdeclarative-devel qt5-qtlocation-devel qt5-qtcharts-devel \
       qt5-qtdeclarative-devel
Once you have installed these packages, you can jump directly to download the source code and build gnss-sdr-monitor.
If you are using openSUSE Leap or openSUSE Tumbleweed:
$ zypper install gcc-c++ cmake git boost-devel protobuf-devel libqt5-qtnetworkauth-devel \
       libQt5PrintSupport-devel libQt53DQuick-devel libqt5-qtlocation-devel libQt5Charts5-devel
Once you have installed these packages, you can jump directly to download the source code and build gnss-sdr-monitor.
$ git clone https://github.com/acebrianjuan/gnss-sdr-monitor
$ cd gnss-sdr-monitor/build
$ cmake -Dprotobuf_MODULE_COMPATIBLE:BOOL=ON ..
$ make
This will create the gnss-sdr-monitor executable at the gnss-sdr-monitor/src directory. You can run it from that folder, but if you prefer to install gnss-sdr-monitor on your system and have it available anywhere else, do:
$ sudo make install
$ cd src/
$ ./gnss-sdr-monitor


