Live page: https://aaroncohen.github.io/barttraffic/
RECENT VERSIONS OF CHROME/SAFARI/OPERA ONLY, uses ECMAScript 6/7 features without translation/polyfill. Firefox will likely not support ES7 modules until v60 is released, at the earliest. If you're running the v59 betas, you can enable the dom.moduleScripts.enabled setting in about:config, and the page will work.
The page does work on Mobile Safari, though it needs a little polish, there.
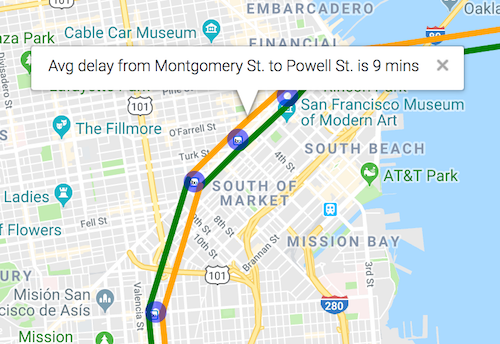
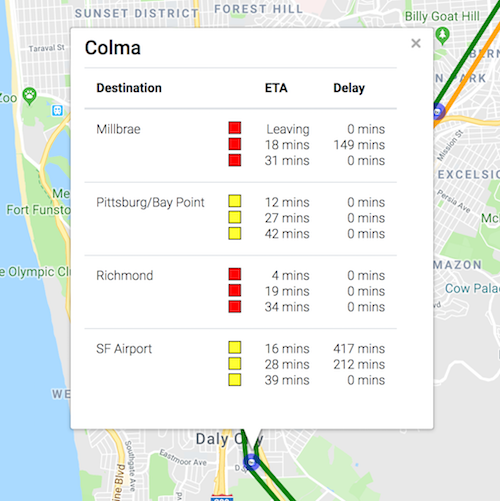
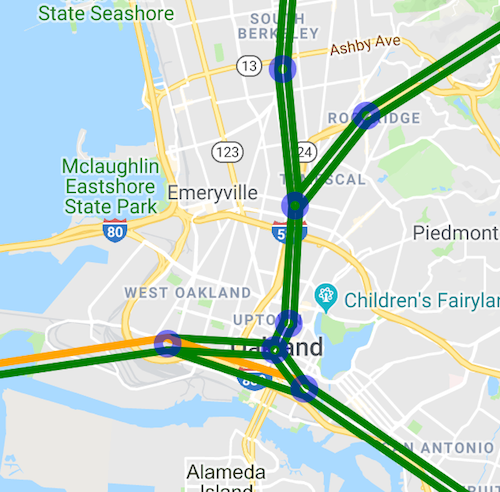
A visualization tool for the BART (Bay Area Rapid Transit) API that shows train delays as "Traffic" between stations, similar to the way that Google Maps shows vehicular traffic.
If all of the lines are green, great! No traffic!
This was written as an opportunity to learn ECMAScript 6 Javascript. I'm making an attempt to use every modern feature supported by recent browsers, without relying on pre-compilation to add old browser support.
It is entirely client side, and hammers the BART API a bit when pulling down information about the location of every station as well as estimated train arrival times, as there are no bulk methods available for getting train delay information.
TODO:
- In the repo I've got a GeoJSON representation of the actual track routes -- I'd like to use those rather than just drawing naive lines between the stations. They represent the system as a whole, not the connections between stations, though, so that's a somewhat daunting task.