#64 - Habit Tracking With Light and Thermal Sensors (screencast)
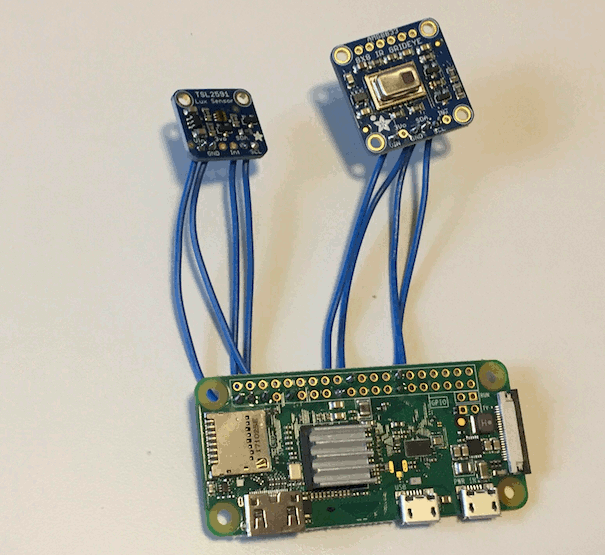
This is the software for a data logger using a Raspberry Pi Zero W, Adafruit AMG8833 IR Thermal Camera Breakout, and an Adafruit TSL2591 High Dynamic Range Digital Light Sensor. The idea is to put several of these in a room to detect visible and non-visible light. The goal is to track my work and sleeping habits based on presence in a particular room. This program will allow you to connect to a web server on the Raspberry Pi and view the current sensor states. But, the program will also log events each minute in JSON format to the console for later analysis (or redirect the output to a log file).
You'll need to have both the AMG8833 and TSL2591 sensors connected to the I2C bus on the Raspberry Pi. I am using two I2C buses, since I just connected the sensors directly, and didn't want to use an extra break out. You could easily just use a single I2C bus too here. The drivers allow you to pick the bus though. Use i2cdetect -y 0 or i2cdetect -y 1 to verify you have both sensors connected.
root@raspberrypi:~/sense# i2cdetect -y 0
     0  1  2  3  4  5  6  7  8  9  a  b  c  d  e  f
00:          -- -- -- -- -- -- -- -- -- -- -- -- --
10: -- -- -- -- -- -- -- -- -- -- -- -- -- -- -- --
20: -- -- -- -- -- -- -- -- -- -- -- -- -- -- -- --
30: -- -- -- -- -- -- -- -- -- -- -- -- -- -- -- --
40: -- -- -- -- -- -- -- -- -- -- -- -- -- -- -- --
50: -- -- -- -- -- -- -- -- -- -- -- -- -- -- -- --
60: -- -- -- -- -- -- -- -- -- 69 -- -- -- -- -- --
70: -- -- -- -- -- -- -- --

root@raspberrypi:~/sense# i2cdetect -y 1
     0  1  2  3  4  5  6  7  8  9  a  b  c  d  e  f
00:          -- -- -- -- -- -- -- -- -- -- -- -- --
10: -- -- -- -- -- -- -- -- -- -- -- -- -- -- -- --
20: -- -- -- -- -- -- -- -- -- 29 -- -- -- -- -- --
30: -- -- -- -- -- -- -- -- -- -- -- -- -- -- -- --
40: -- -- -- -- -- -- -- -- -- -- -- -- -- -- -- --
50: -- -- -- -- -- -- -- -- -- -- -- -- -- -- -- --
60: -- -- -- -- -- -- -- -- -- -- -- -- -- -- -- --
70: -- -- -- -- -- -- -- --
go get -u github.com/jweissig/amg8833
go get -u github.com/mstahl/tsl2591
git clone https://github.com/jweissig/sense.git
You can connect to a web server on localhost:8787 that will show you the Lux and Thermal sensor data in a gnuplot window. GNUPlot is pretty useful for hacking around with the pixel data (reverse or rotate plotted sensor data). Data will also be logged to the console where you can pipe/redirect into a logging file.
go run sense.go
Here's an example of the JSON.
{
   "Timestamp":"2019-01-02T22:25:49.730118711-08:00",
   "Pixels":[
      21.25,
      23.25,
      22.25,
      ...
      19.75,
      20.5,
      20.75
   ],
   "Lux":34.163544303797465
}
Here's a snap from the web interface (me standing next to the computer).

