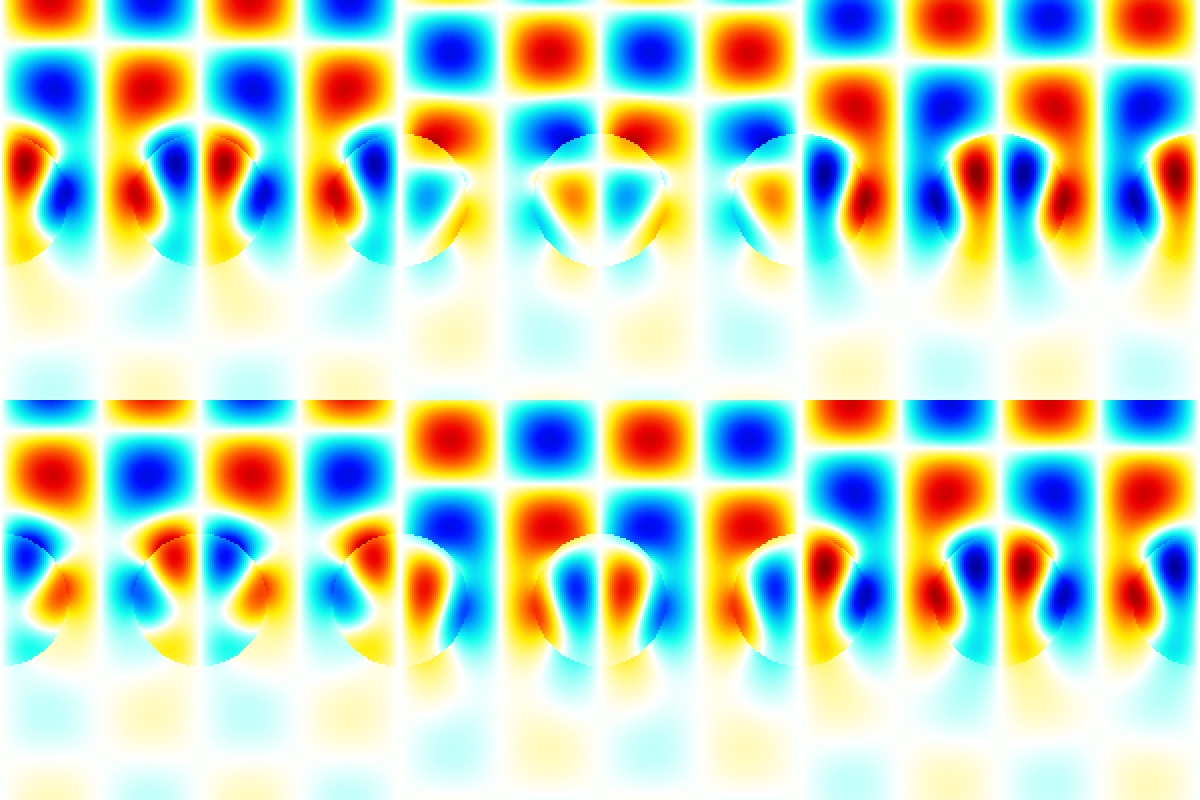
This is the two-dimensional electromagnetic field analysis program for one-dimensional periodic arrangement objects irradiated by a TM plane wave (transverse magnetic wave). This is based on the boundary element method, the own developed numerical solution is used. Intel Math Kernel Library and libpng are required. Gmsh is used to create mesh data for an object. The "d3_qpgf_d1" is used to calculate quasi-periodic Green's function for Helmholtz equations.
-
type 'make' command to compile.
The executable d2qtm_bv_solver, example1.out, example2.out, example3.out are created. The executable d2qtm_bv_solver is the main solver of the boundary integral equations. The example1.out is the executable of source code example1.c, it shows a simplest example using "bem2_emf_qtm". The example2.out is the execubable of source code example2.c, it shows a example of electromagnetic field intensity analysis. The example3.out is the executable of source code example3.c, it shows a example of outputting the instantaneous value of electromagnetic field as an image. -
type './d2qtm_bv_solver' with arguments of incident field datafile name, medium datafile name, mesh datafile name, periodicity datafile name and output dafafile name.
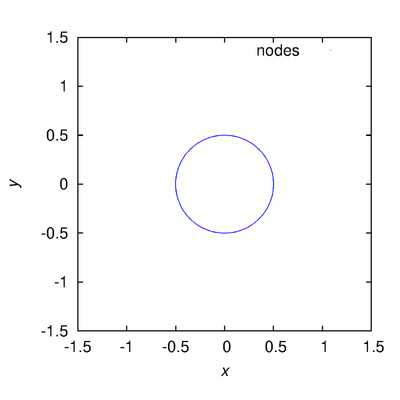
For example, './d2qtm_bv_solver ifd.txt medium_data.txt circle_1.msh periodicity_data.txt ex.dat'. The ifd.txt is the sample of incident field datafile, a TM plane wave is defined in it. The medium_data.txt is the sample of medium datafile, one medium is defined in it. The domain numbers are assigned to the medium from 1 in order. The circle_1.msh is the example of mesh datafile, it is an object with a circular cross section. It was created by using Gmsh geometry file circle_1.geo in the mesh_sample folder. The periodicity_data.txt is the sample of periodicity setting datafile, periodic boundary condtion and lattice constant are defined in it. The d2qtm_bv_solver solves boundary integral equations with the specified datafiles, outputs the results to a binary file with the output datafile name. It has optional arguments for rotation and translation of the object. For the rotation angle around the z-axis is theta and the translation vector is (tx, ty), the arguments are './d2qtm_bv_solver ifd.txt medium_data.txt circle_1.msh periodicity_data.txt ex.dat theta tx ty'. As a simple representation of the analysis model, the nodes used for the surface integral are output as a point cloud data. In this example, the file ex.particles is output and the visualization result is particles.png (using Gnuplot script gscript_particles.plt). -
type './example1.out' with an argument of datafile name output by d2qtm_bv_solver.
For example, './example1.out ex.dat'. This executable calculates electromagnetic field, radiation force and torque. -
type './example2.out' with an argument of datafile name output by d2qtm_bv_solver.
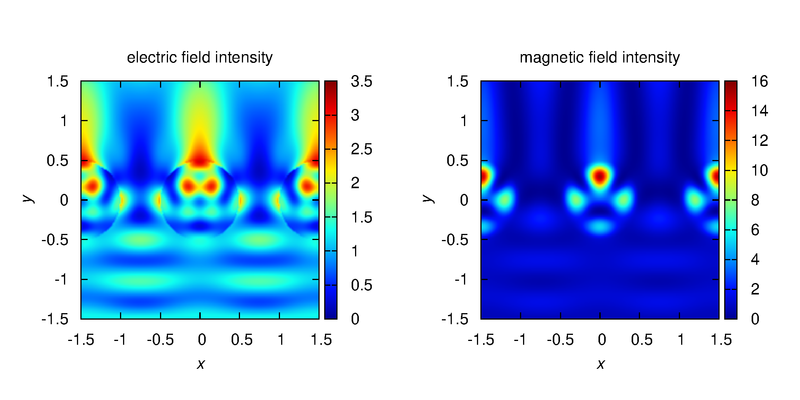
For example, './example2.out ex.dat'. This executable calculates electromagnetic field intensity distributions, outputs them to text files. The I_example2.png is the visualization result of intensity distributions, created by using Gnuplot script gscript_example2.plt. -
type './example3.out' with an argument of datafile name output by d2qtm_bv_solver.
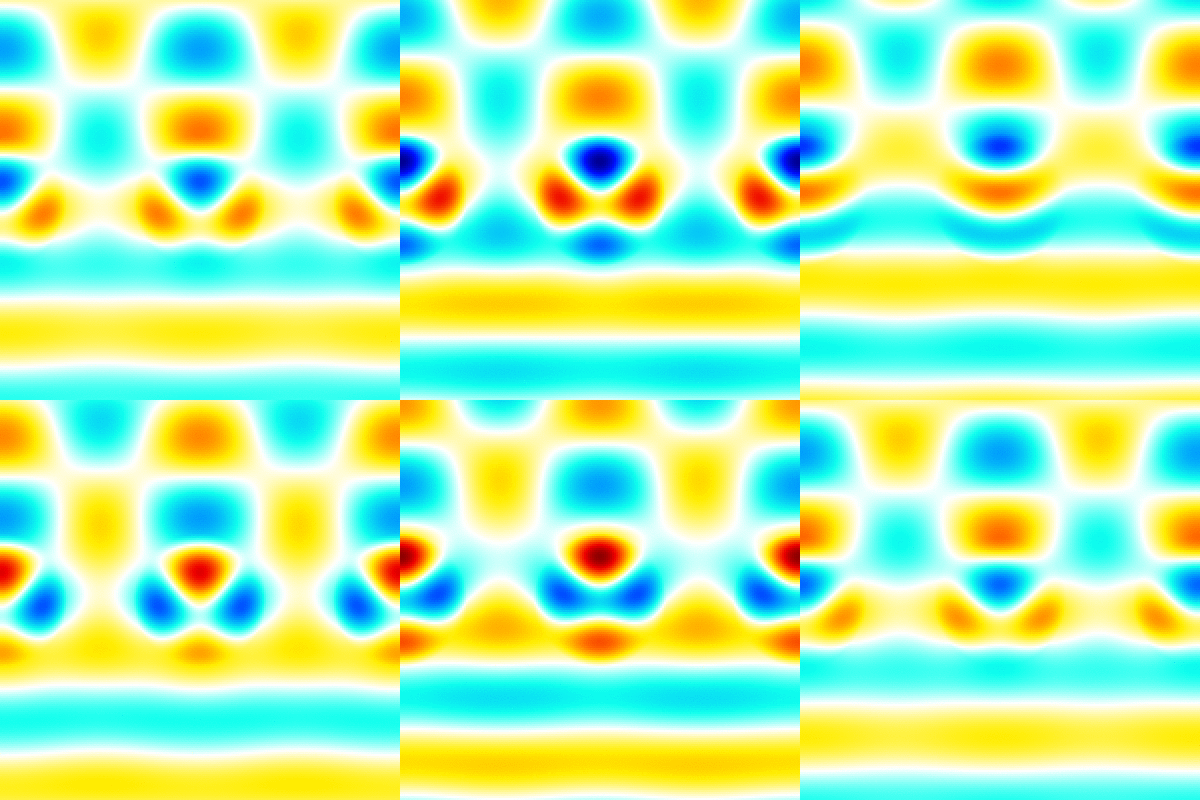
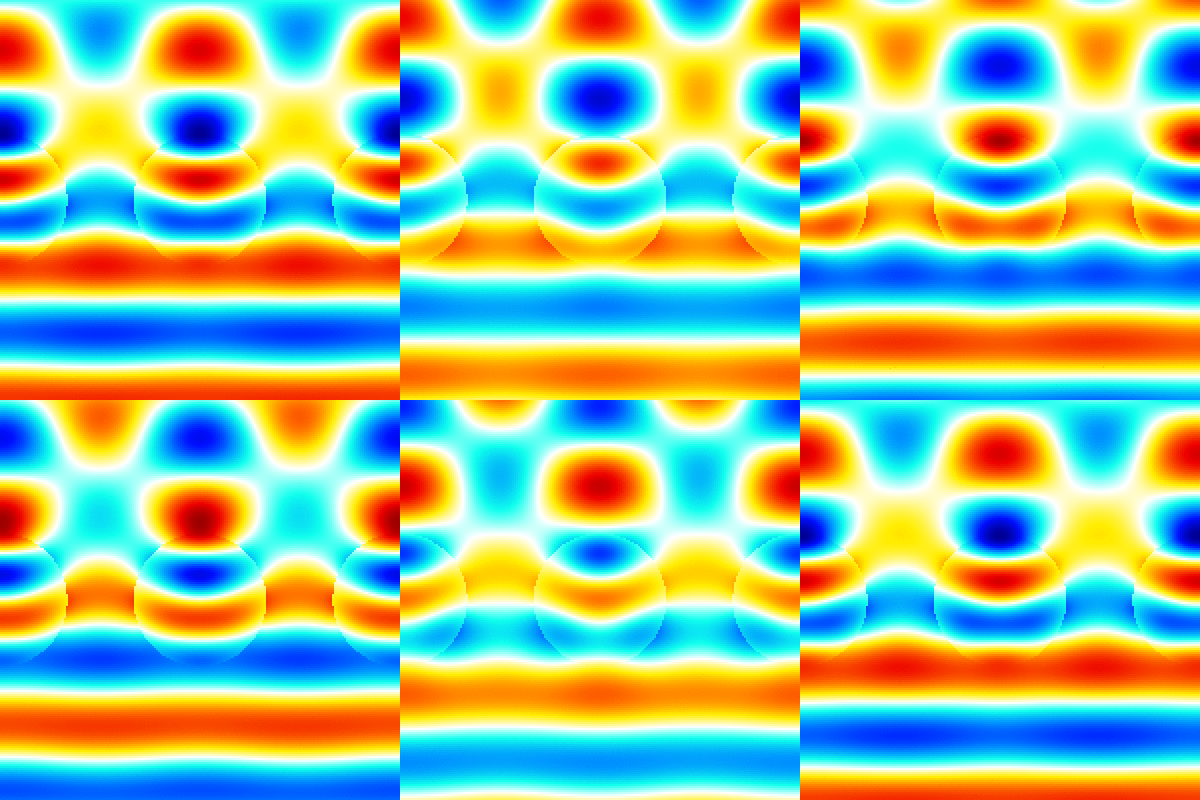
For example, './example3.out ex.dat'. This executable calculates instantaneous value of the electromagnetic fields, outputs them to png image files. The image files are output to the folder which has a name adding "images" to the datafile name specified in the argument (file-extension is excluded). Each image file has a name that indicates the cross section, field component and number of time steps (ex. xy_Hz_014.png). The color bar is output as color_bar.png in the same folder. The range of color bar is output to the xy_info.txt file. The xy_Hz.gif, xy_Ex.gif and xy_Ey.gif are animated gifs that concatenate the png files created by using the shell script gif_animation.sh.
Please see d2qtm_src/bem2_emf_qtm.h for detail of functions. The main parts of the code are parallelized by using OpenMP. The number of threads is controlled by the environment variable OMP_NUM_THREADS. The additional analysis examples are in the folder analysis_sample1 ~ analysis_sample4.
The first verification result is in the folder verification1. This result is the approximation of the example code model with 17 cylinders.
The second verification result is in the folder verification2. This analysis approximates the multilayered substrate by periodically arranging quadrangular objects in close. The analytic solution can be obtained by using the code "emf_multilayer".
This program can use parabolic (three-node second order line) element. The samples of mesh data are in the folder mesh_sample. The file with extension .geo is the Gmsh geometry file. The file with extension .msh is the mesh datafile created by using Gmsh geometry file. These mesh files are created by the command 'gmsh -1 -order 2 -tol 1.0e-15 xxxx.geo' in command-line (xxxx.geo is a geometry file). The domain number (Physical Line) 99 is assigned to the open region in Gmsh geometry file, because Gmsh can't use the number 0 (assigned to open region in the code). Please refer to the manual of Gmsh for detail of geometry file.
This program use the own defined system of units (OSU), optimized for optics.
The system of units is defined as ( speed of light in vacuum ),
( permeability of vacuum ).
For the conversion from OSU to MKSA system of units, the unit of length in OSU is defined as
[m] in MKSA, the unit of power in OSU is defined as
[W] in MKSA. The conversions of base unit are follows.
,
,
,
,
,
.
Please see com_src/osu_mksa.h and com_src/osu_mksa.c for detail of conversions.
- Intel Math Kernel Library MKL
- The official PNG reference library libpng
- Three-dimensional mesh generator Gmsh
- The command-line driven graphing utility gnuplot
- The utilities for manipulating images ImageMagick
- The calculation program of quasi-periodic Green's function d2_qpgf_d1
- The electromagnetic field analysis program emf_multilayer

