R package to visualize results from population genomics analyses. The package implements low-level function to generate genomics plots and high-level functions to visualize results from the Sex Genomics Toolkit.
The sgtr package development was initiatied in the LPGP lab from INRA, Rennes, France.
The package was developed and tested in R version 3.6.3. It's likely to work under older R versions but there may be unforeseen issues.
The current version of sgtr implements functions to visualize the results from:
- RADSex 1.1.0
- PSASS 3.0.1
# Installation from GitHub requires devtools
install.packages("devtools")
devtools::install_github("SexGenomicsToolkit/sgtr")conda install -c bioconda r-sgtrExamples of data and scripts to generate plots from RADSex and PSASS results are provided in the examples folder. To get the detailed usage for each function, use R's built-in help command ?<function_name>, for instance ?radsex_distrib (or ?sgtr::radsex_distrib if the package was not attached).
The package provides several high-level functions to generate plots from RADSex results (RADSex >= 1.0.0):
| Function | Description |
|---|---|
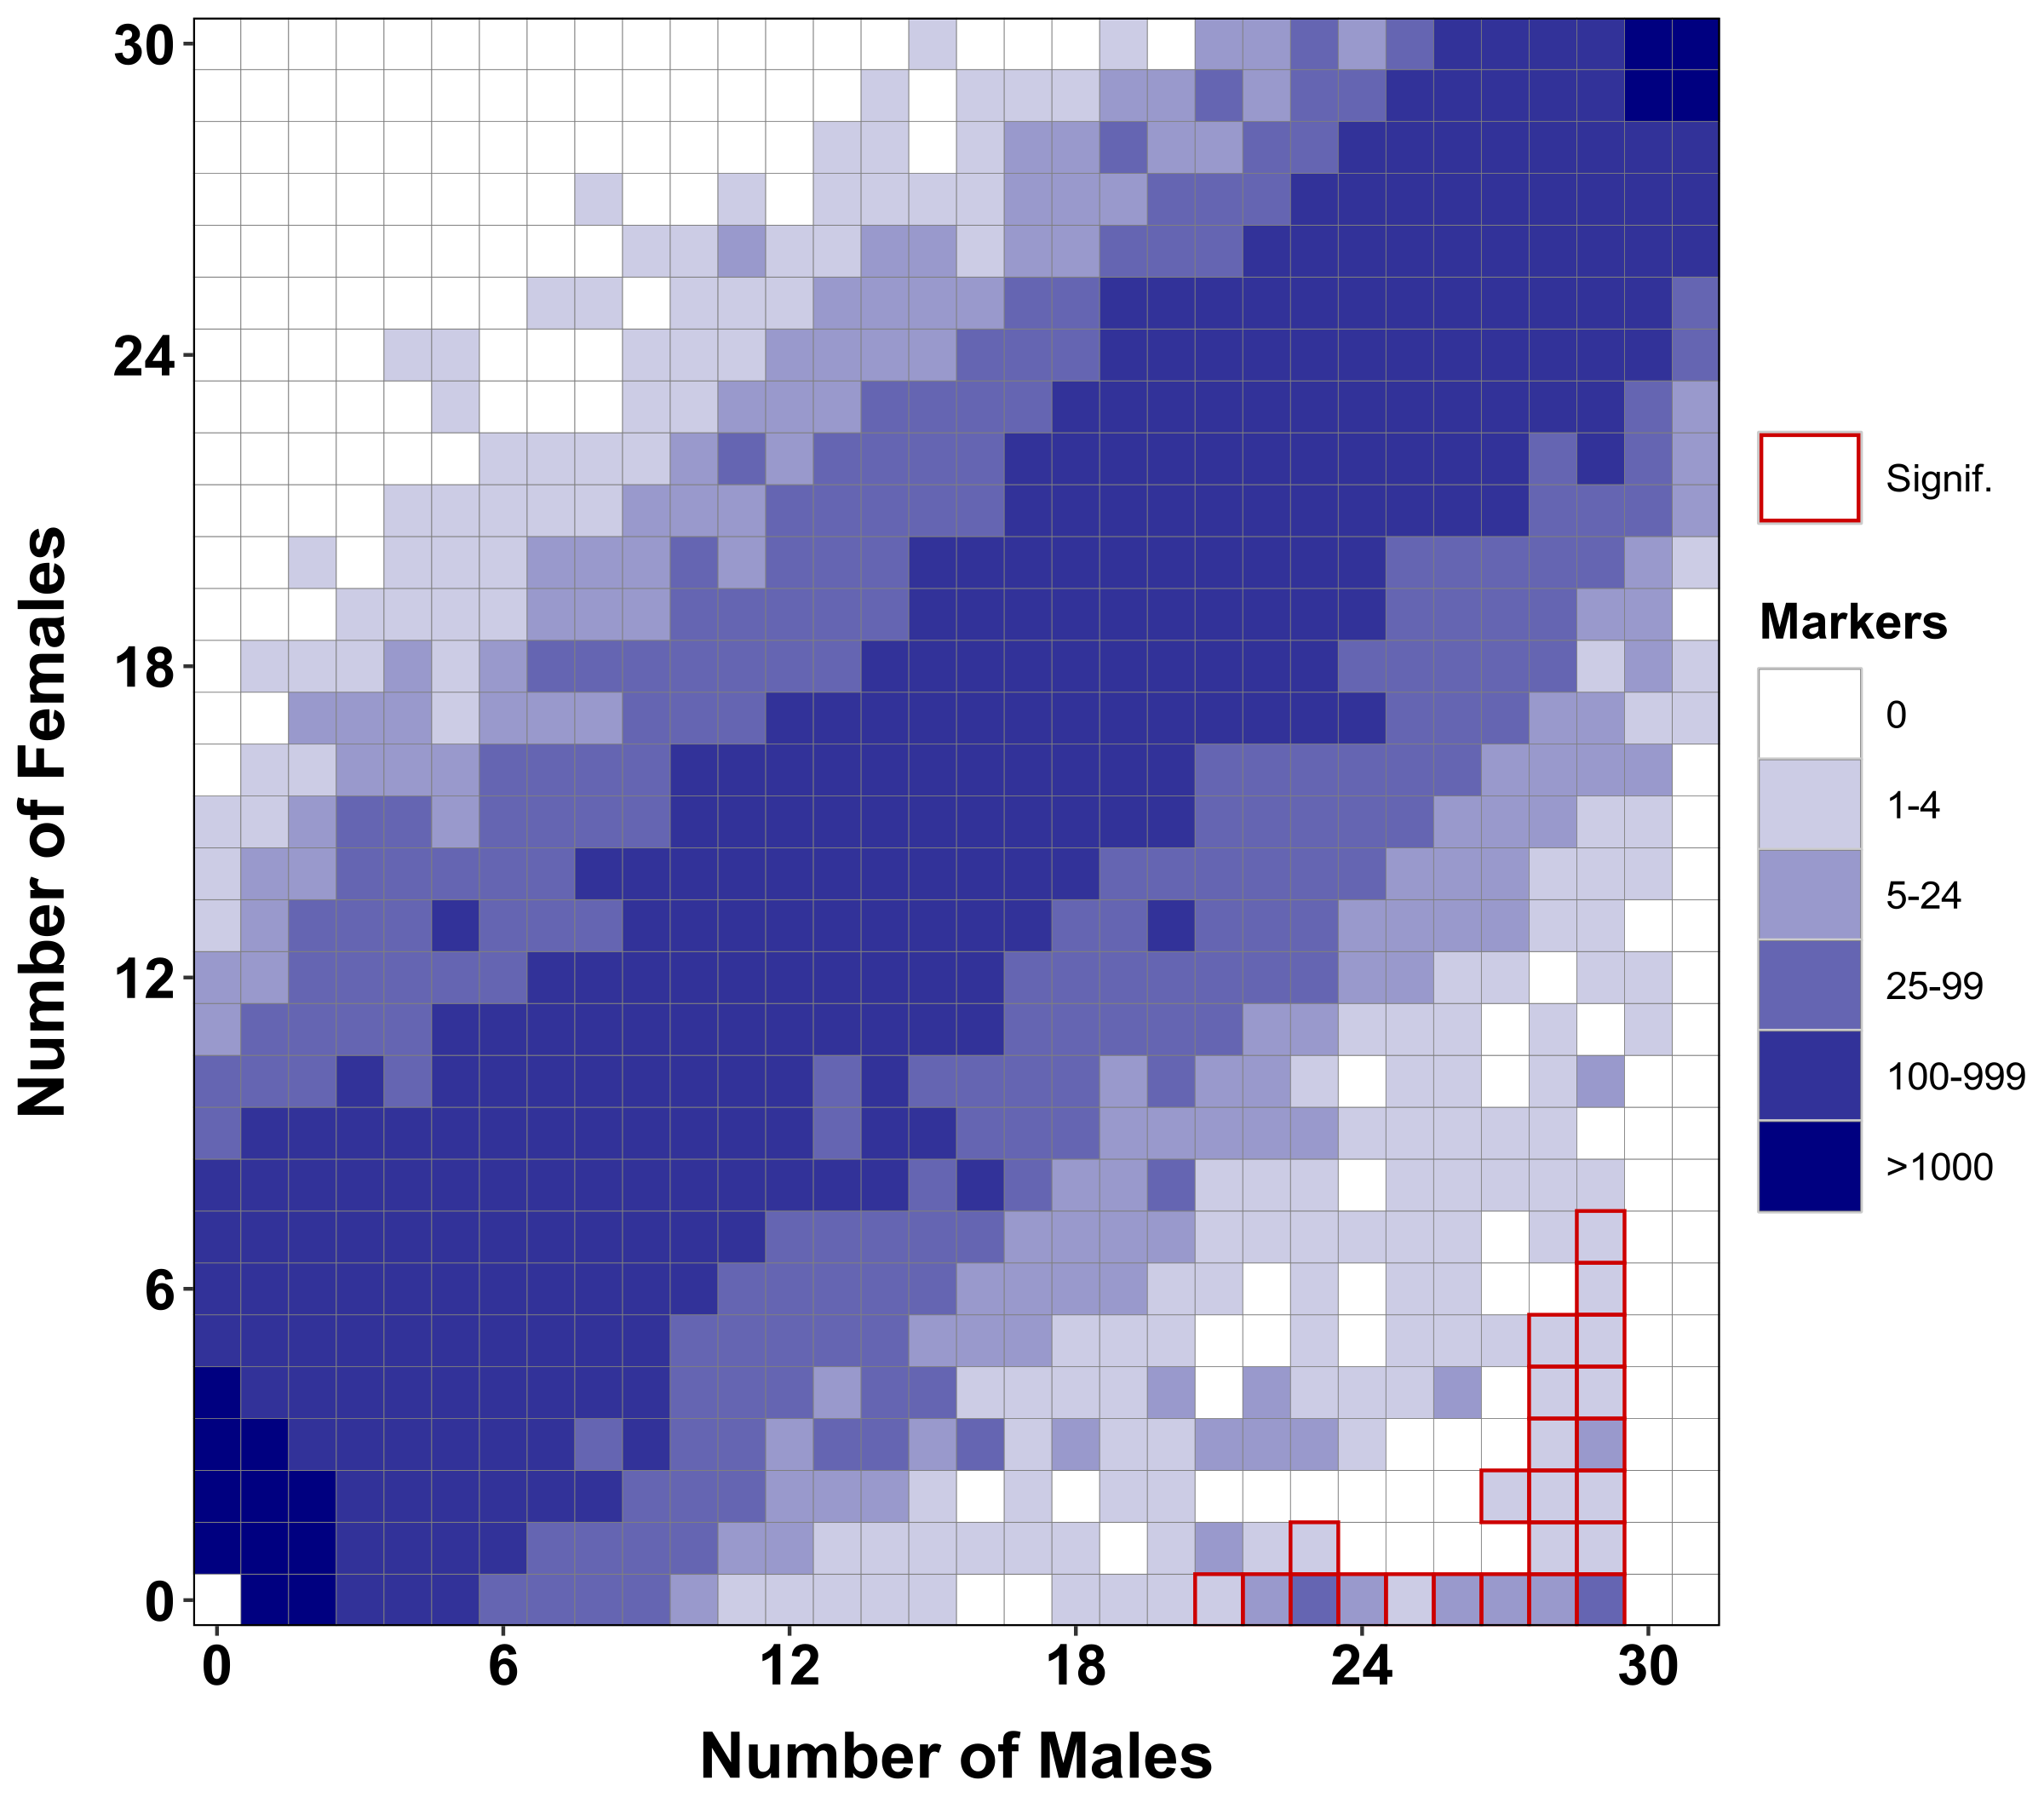
radsex_distrib |
Generate a tile plot of distribution of markers between groups from the results of RADSex distrib |
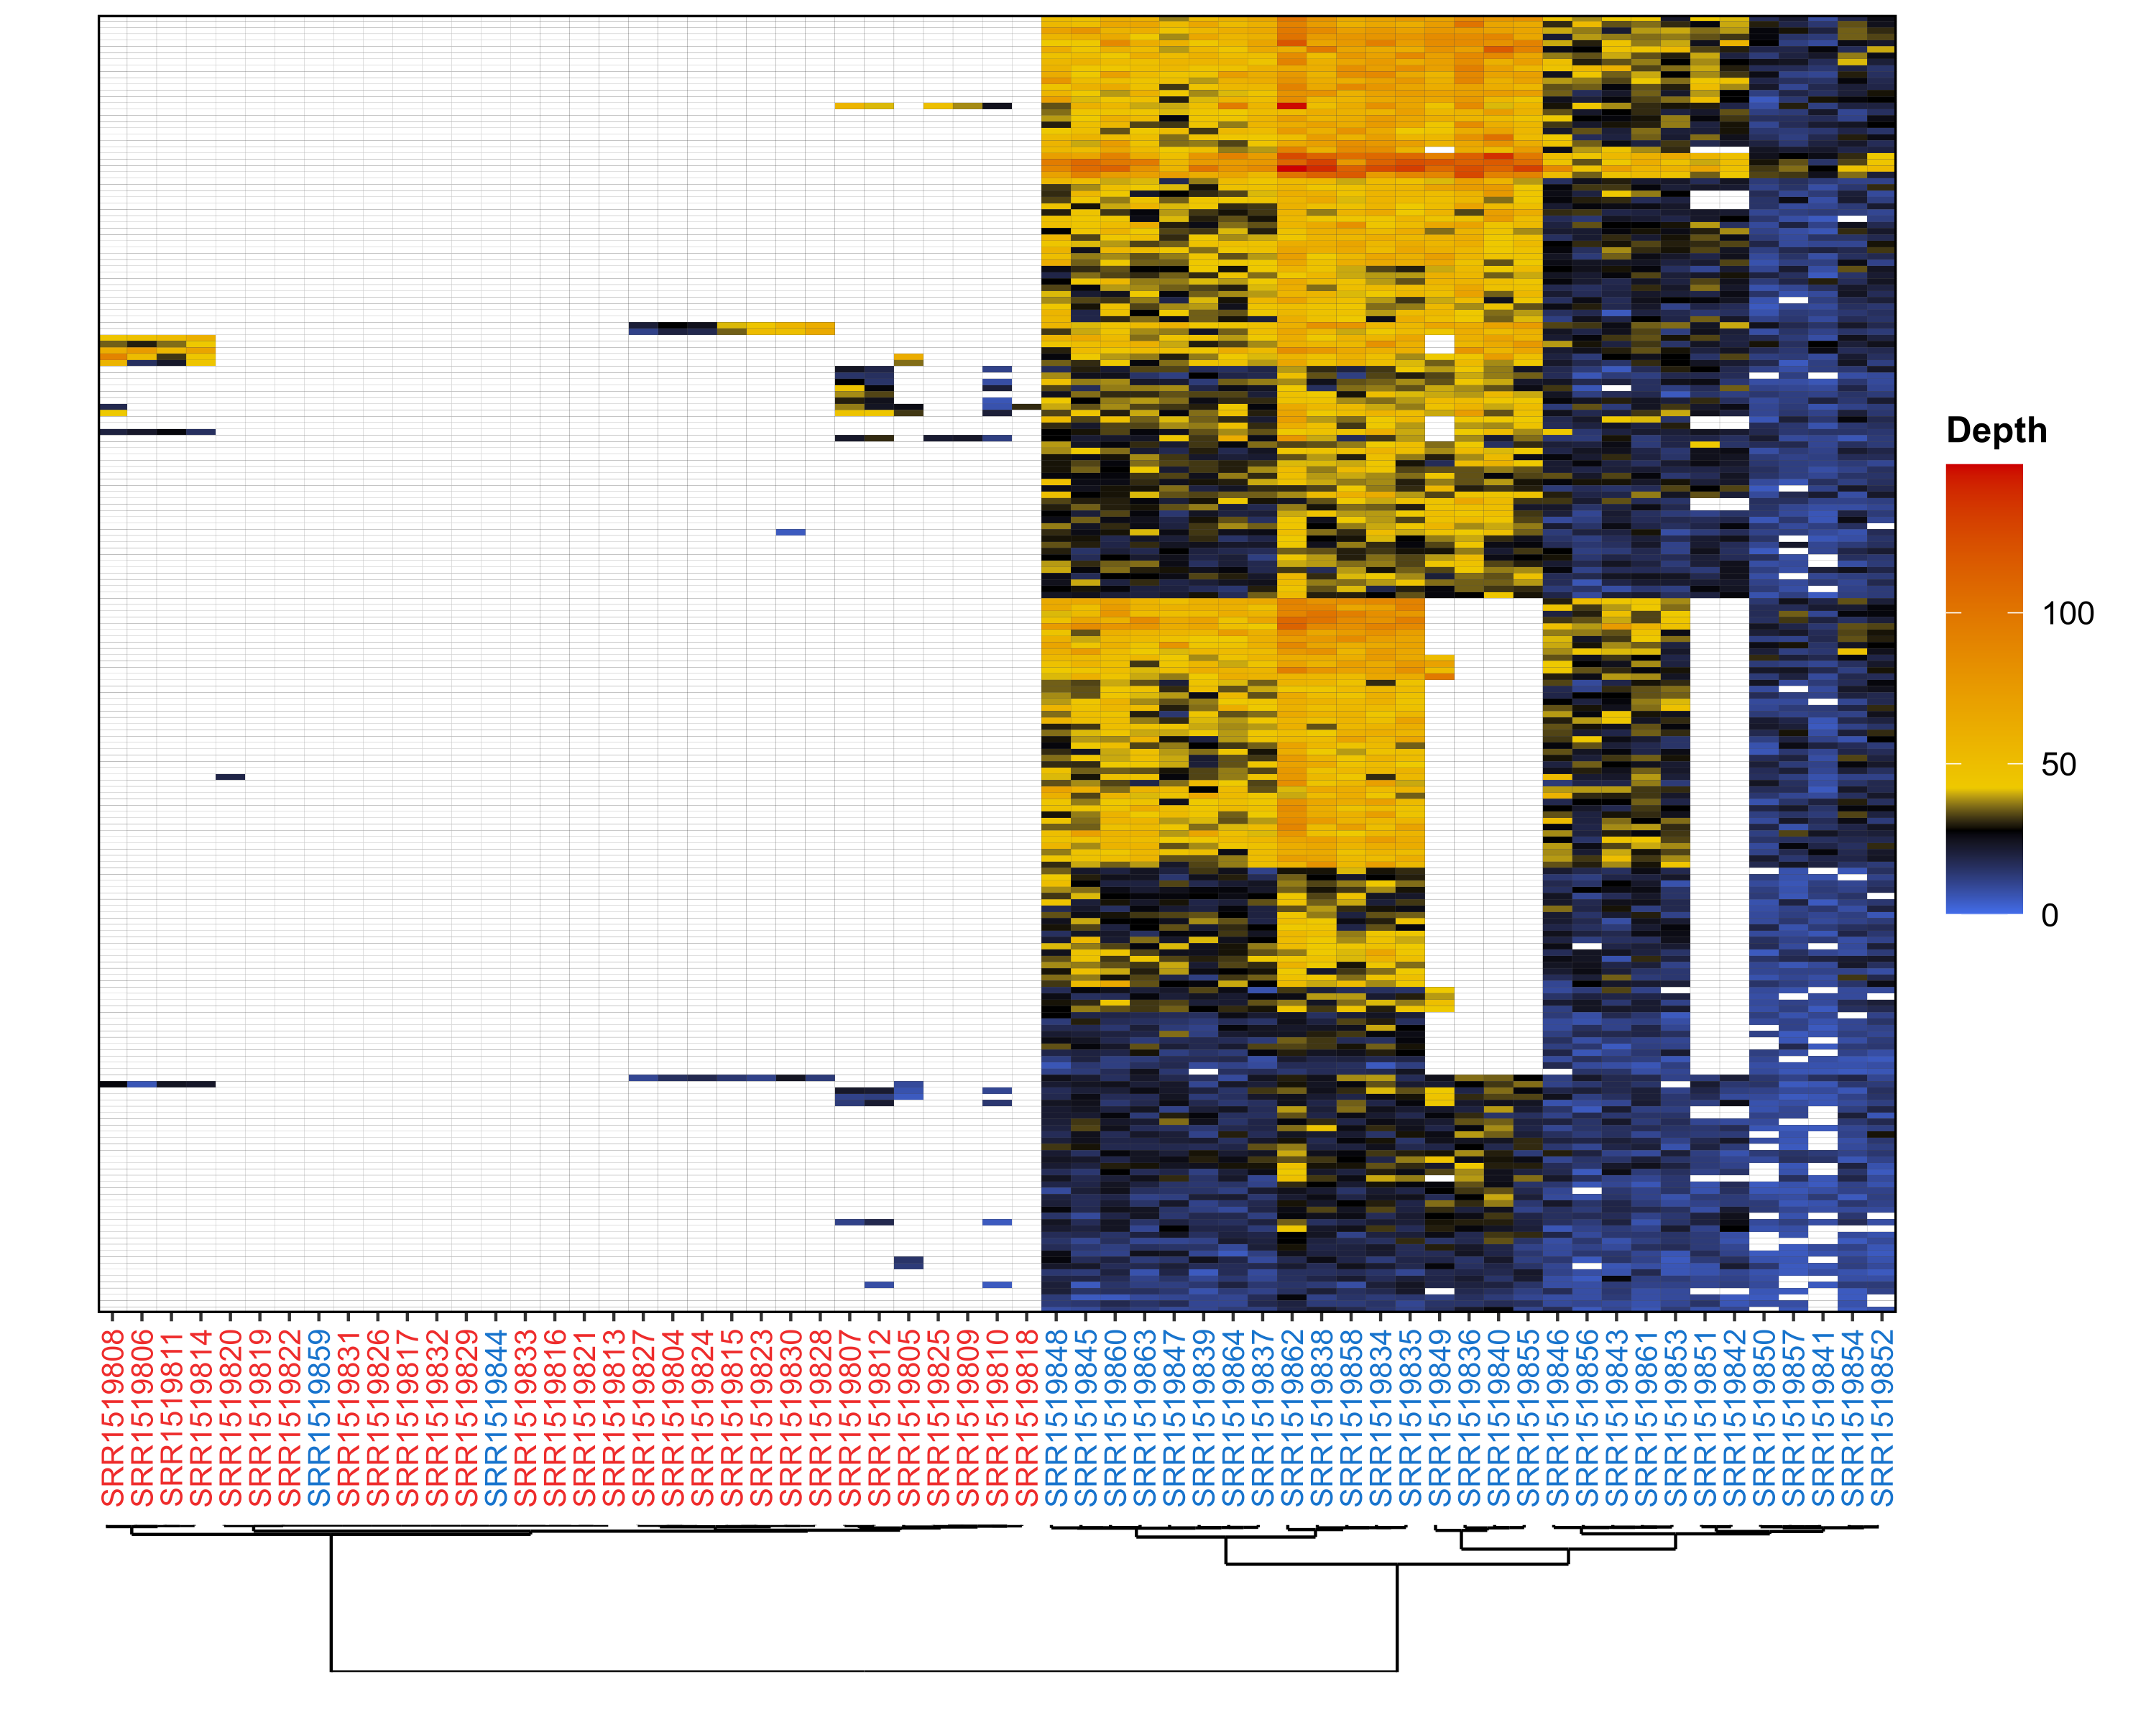
radsex_markers_depth |
Generate a marker depths heatmap from the results of RADSex subset, signif, or process. |
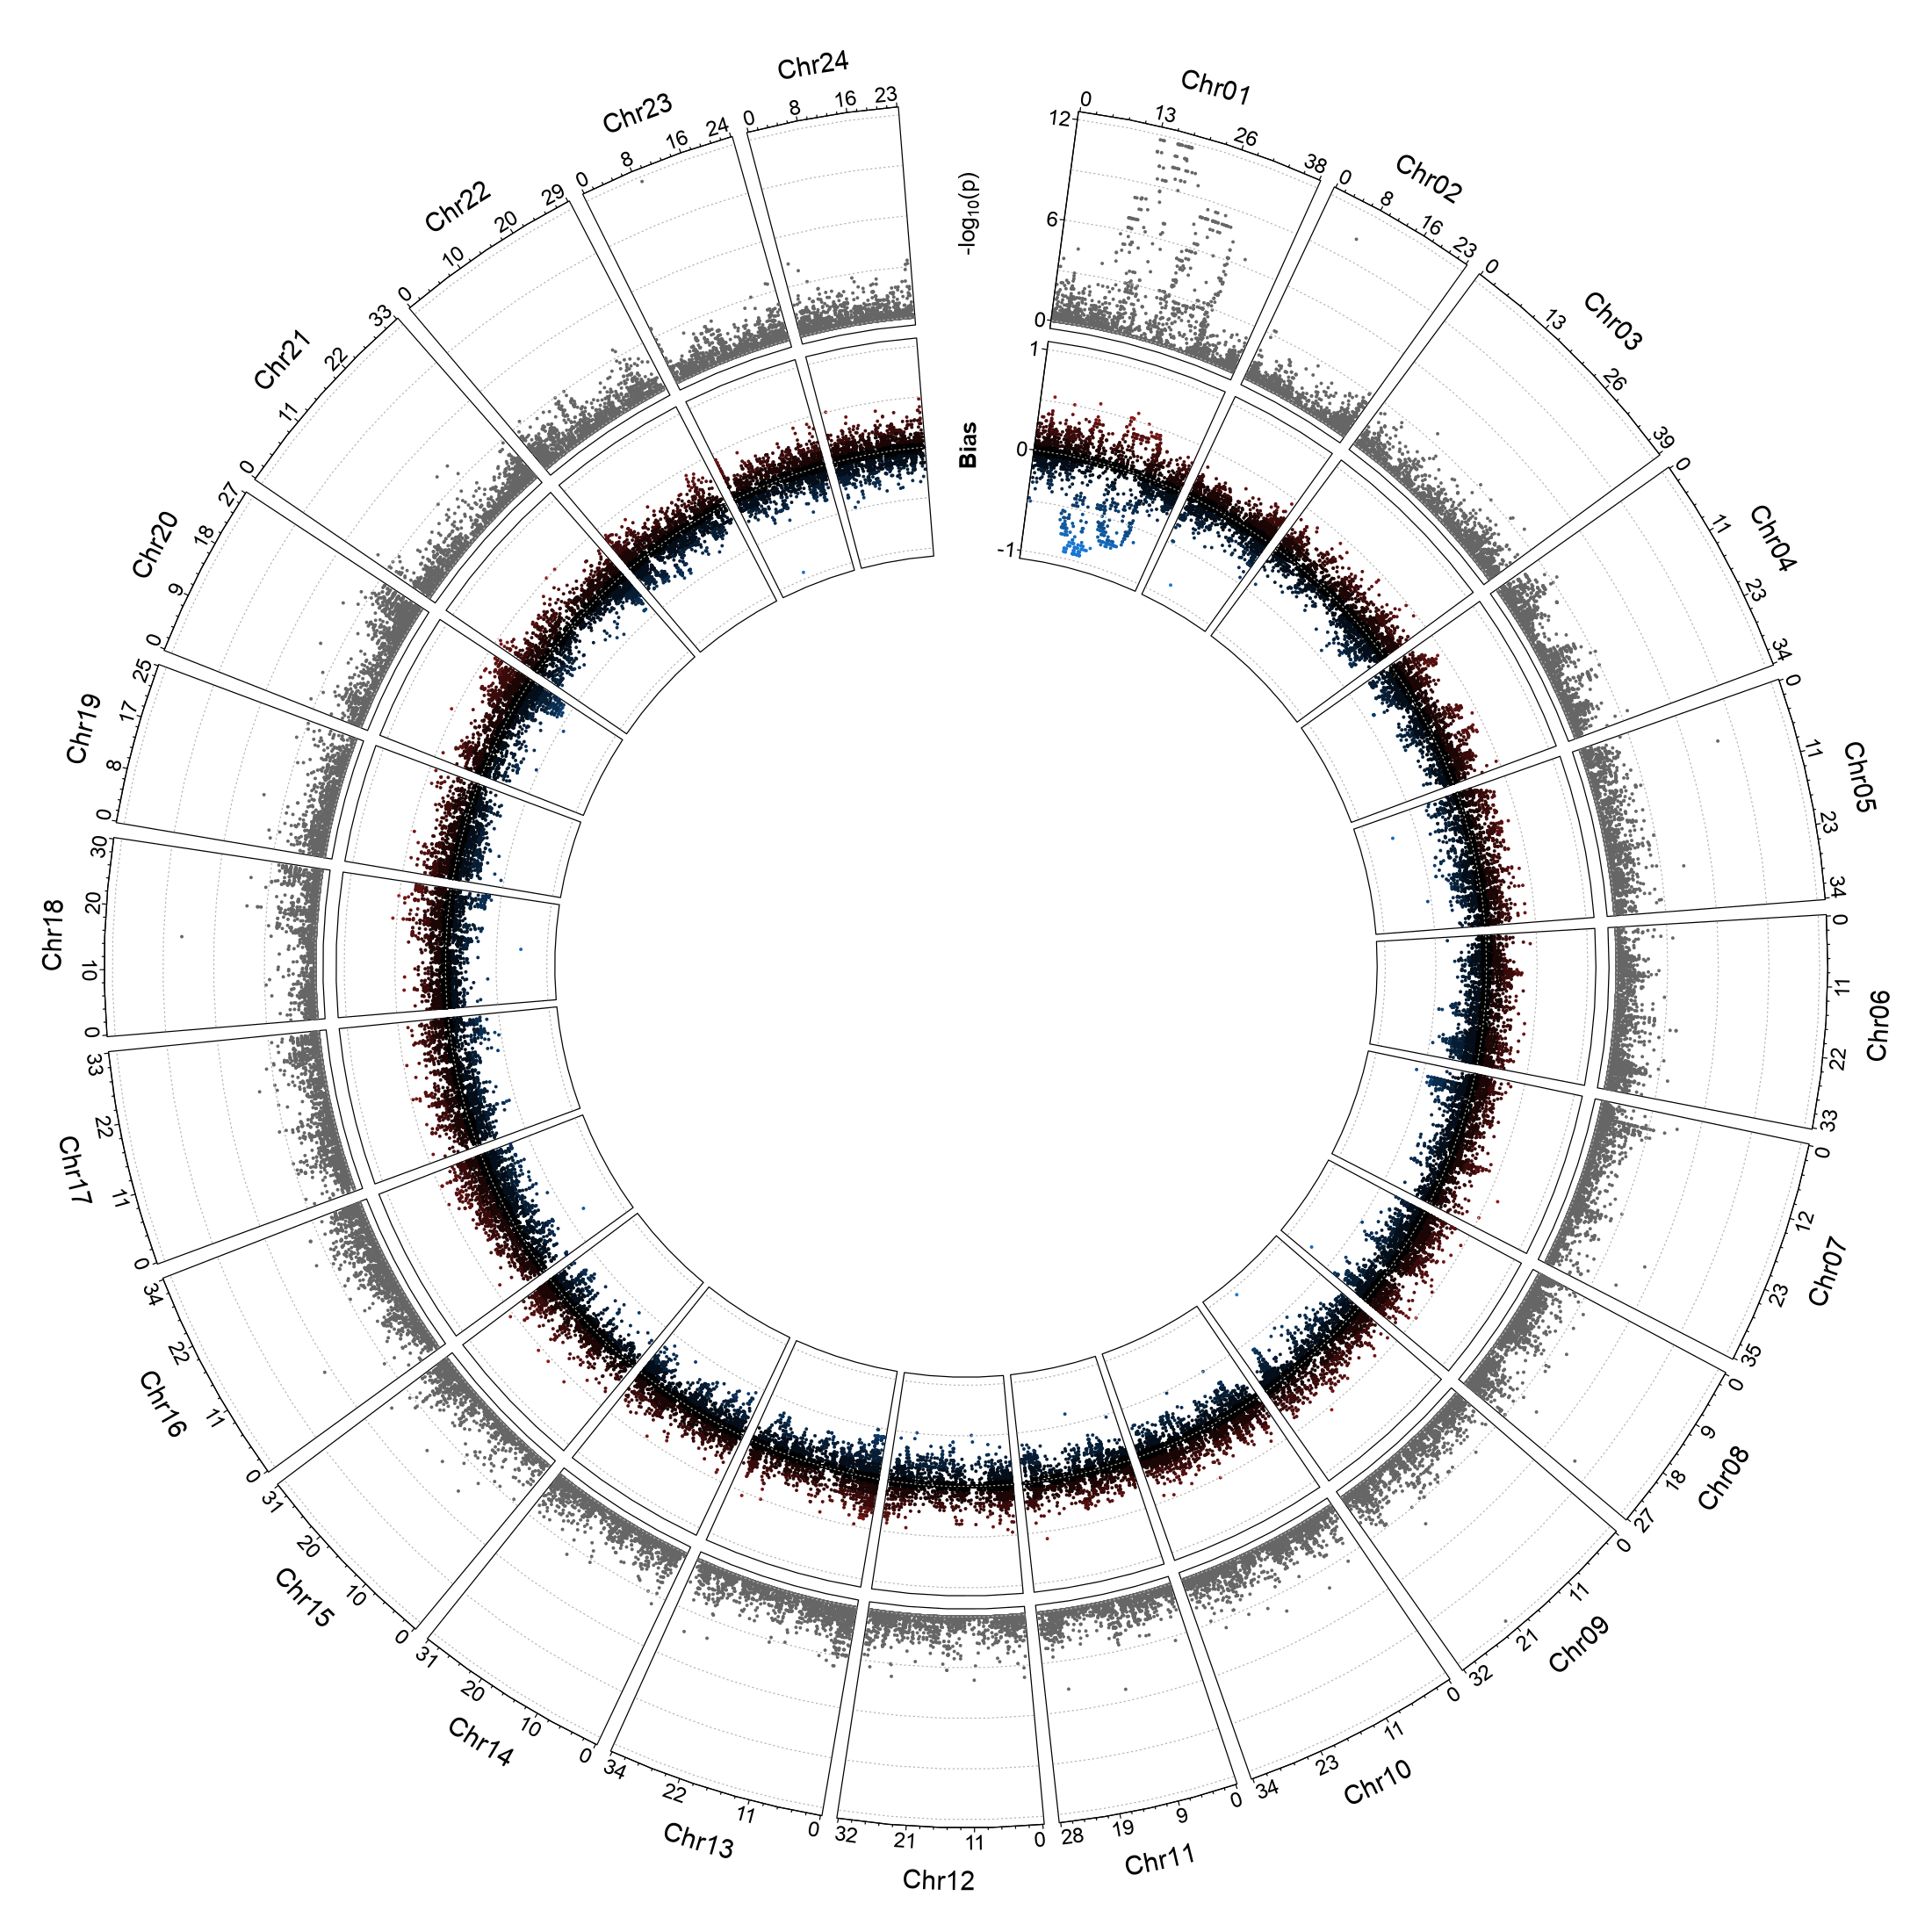
radsex_map_circos |
Generate a circular plot for the entire genome from the results of RADSex map. |
radsex_map_manhattan |
Generate a manhattan plot for the entire genome from the results of RADSex map. |
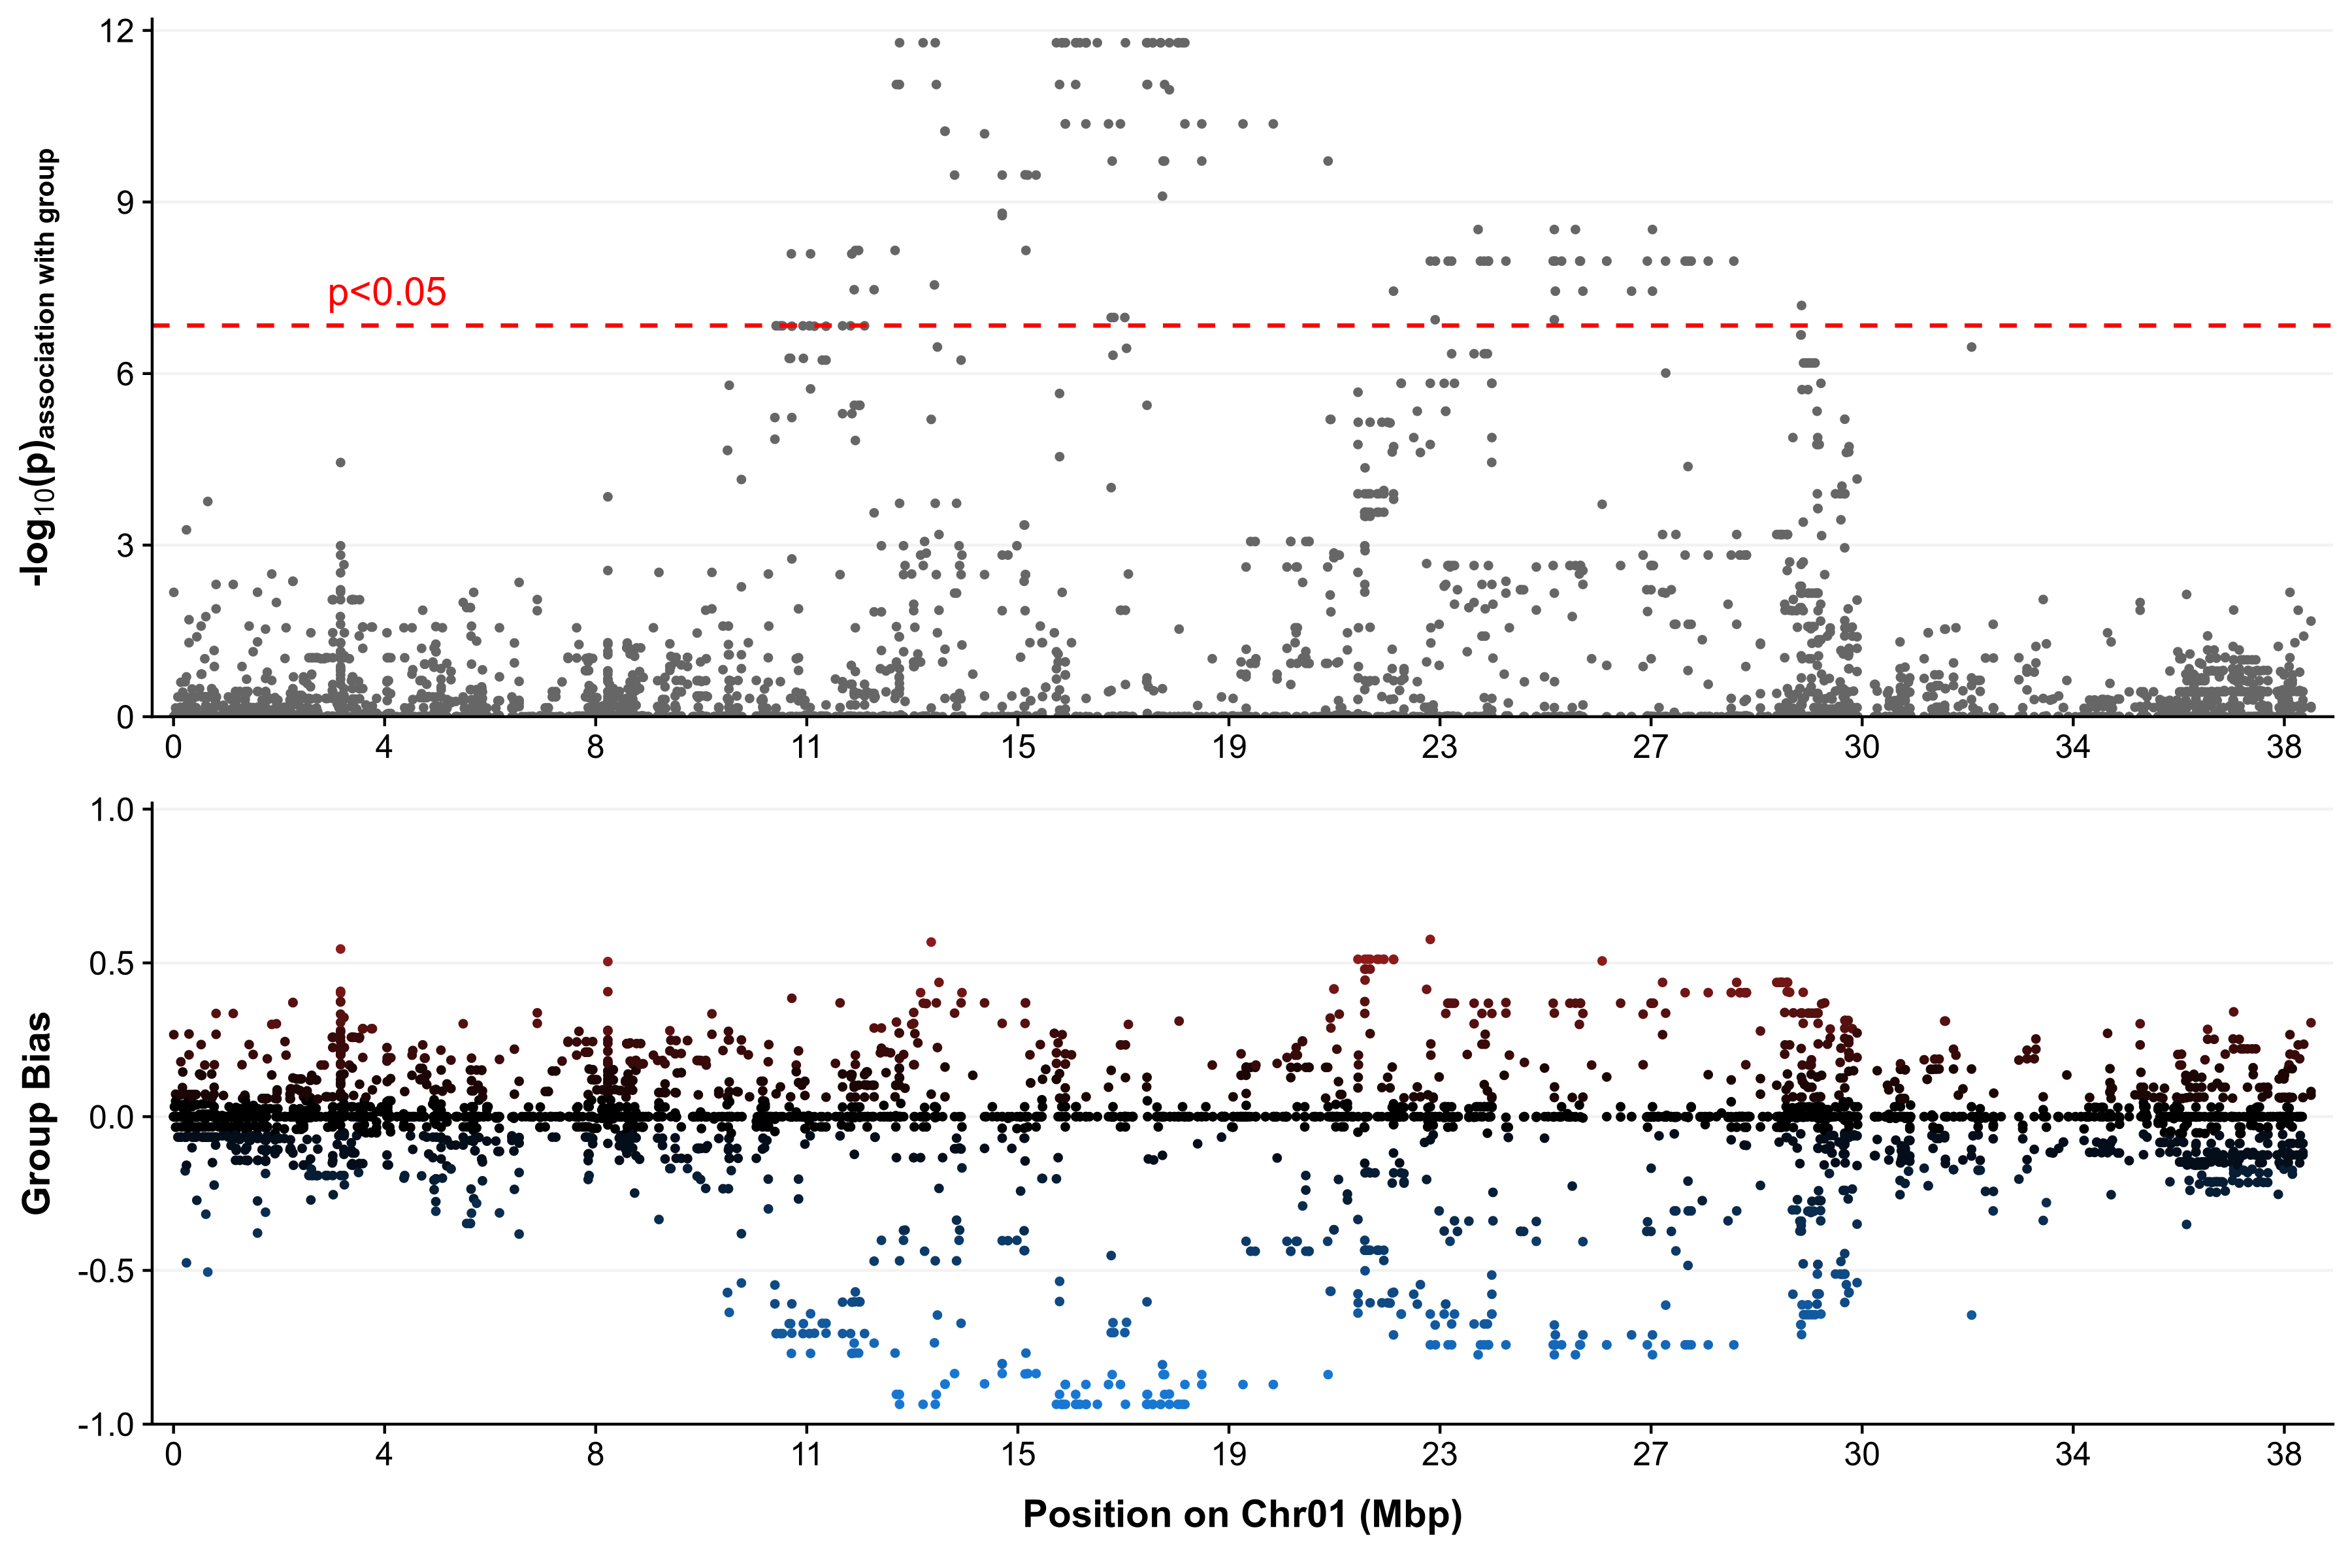
radsex_map_region |
Generate a linear plot for a specific region from the results of RADSex map. |
radsex_depth |
Generate a boxplot with the distribution of a metric for each group or a barplot of the metric's value for each sample for a metric from the results of RADSex depth. |
radsex_freq |
Generate a plot of the distribution of a marker frequencies in all individuals from the results of RADSex freq. |
Examples of results
- Distribution of markers between groups
- Markers depth with clustering
- Circos plot
- Region plot
High-level functions specifically for PSASS results have not been implemented yet (will come soon), but general purpose high-level functions can be used to plot PSASS results:
| Function | Description |
|---|---|
plot_circos |
Generate a circular plot for the entire genome from a genomic metrics file. |
plot_manhattan |
Generate a manhattan plot for the entire genome from a genomic metrics file. |
plot_region |
Generate a linear plot for a specific region from from a genomic metrics file. |
Check the file psass.R in examples/ and the built-in R help pages for examples of how to use these functions.
Copyright (C) 2020 Romain Feron
This program is free software: you can redistribute it and/or modify it under the terms of the GNU General Public License as published by the Free Software Foundation, either version 3 of the License, or (at your option) any later version.
This program is distributed in the hope that it will be useful, but WITHOUT ANY WARRANTY; without even the implied warranty of MERCHANTABILITY or FITNESS FOR A PARTICULAR PURPOSE. See the GNU General Public License for more details.
You should have received a copy of the GNU General Public License along with this program. If not, see https://www.gnu.org/licenses/


