Lazy functions for Jupyter notebooks
Installing:
pip install git+https://github.com/anki-xyz/nutil
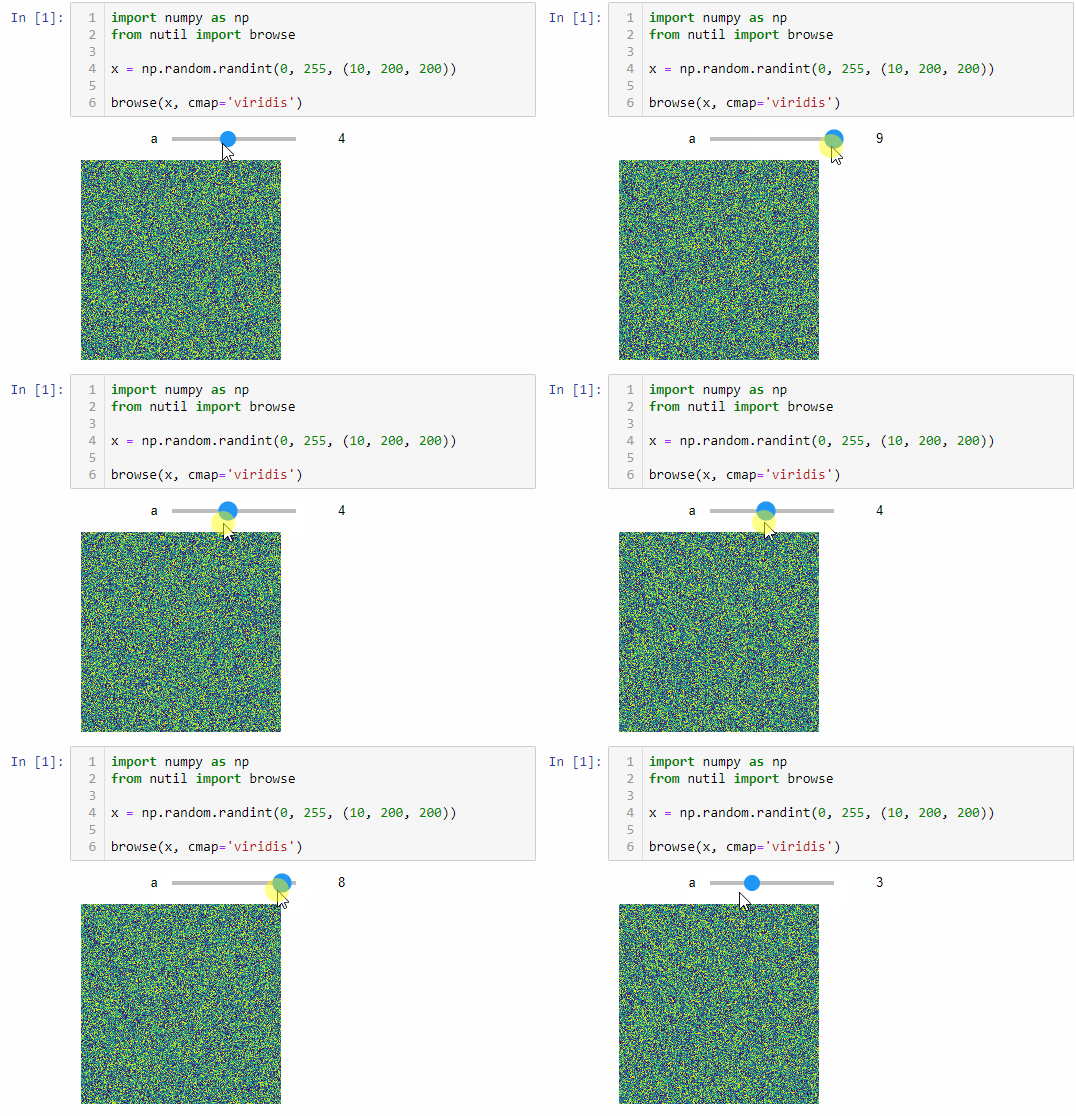
Fast image browsing based on PIL and IPython display.
Usage:
import numpy as np
from nutil.image import browse

x = np.random.randint(0, 255, (10, 200, 200))

browse(x, cmap='viridis')
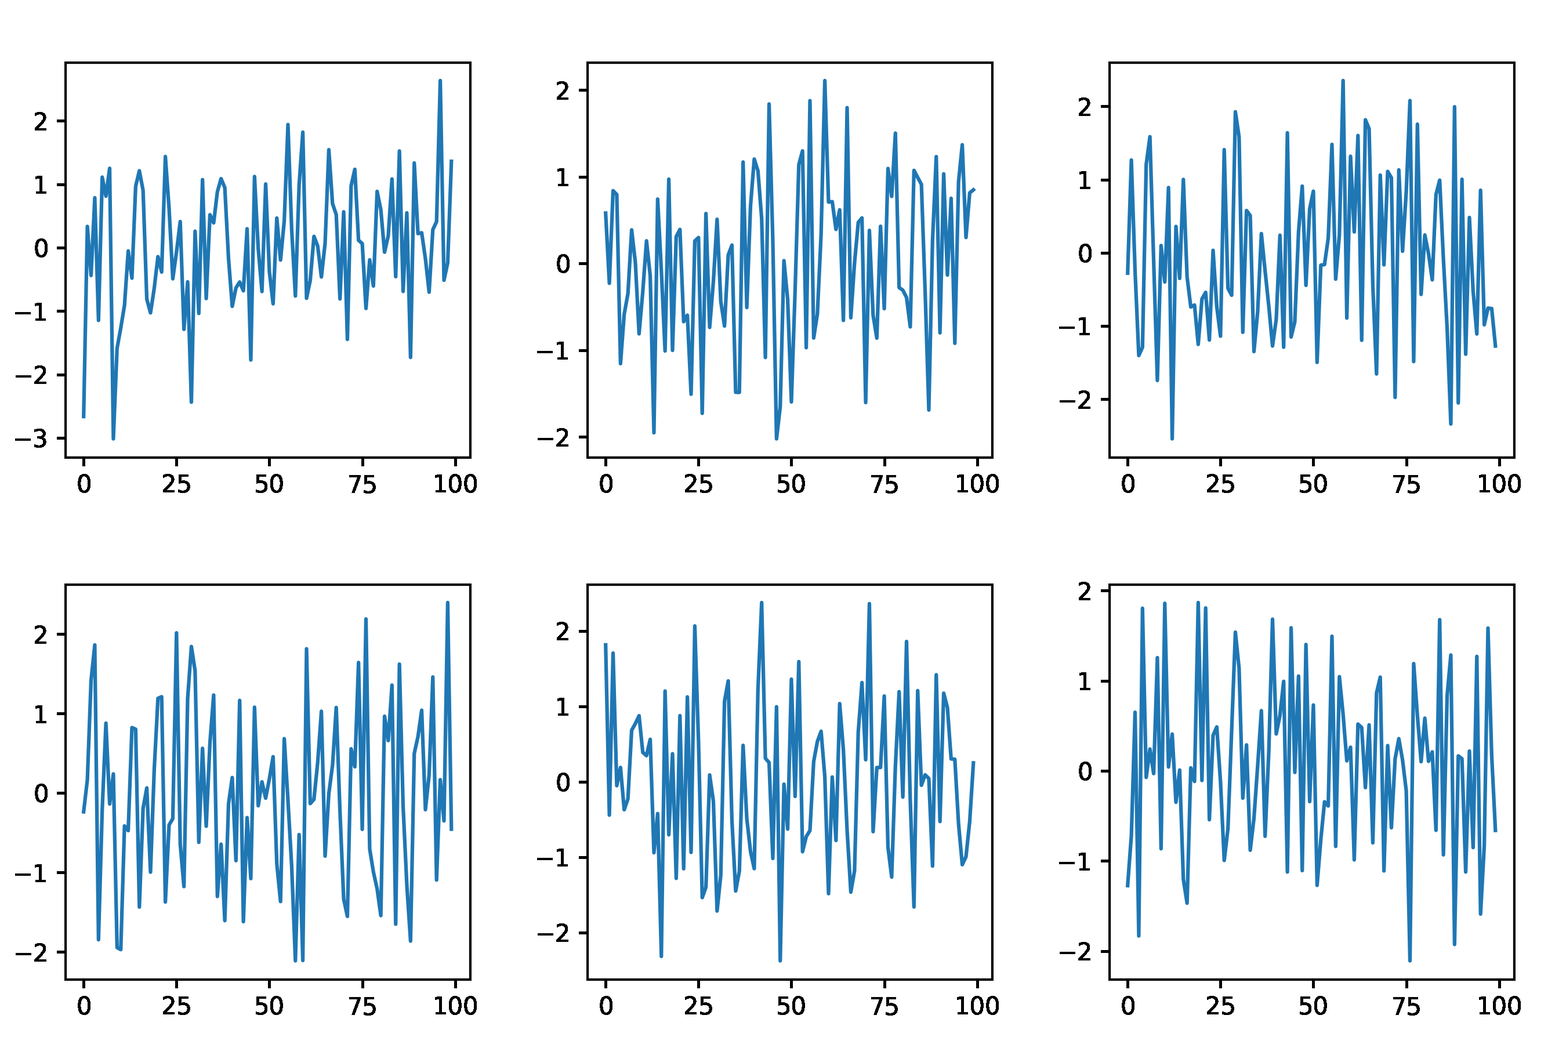
How to grab a figure to an RGB image numpy array:
from nutil.plot import grabFigure
from imageio import mimwrite

ims = []

for _ in range(10):
    fig = plt.figure()
    plt.plot(np.random.randn(100))
    ims.append(grabFigure(fig))

mimwrite("random_plot.gif", ims, fps=3)
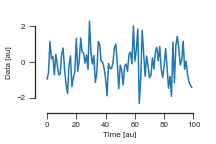
Use this function to make your paper figures nice immediately (and editable in Illustrator & Co!). Checkout the example file in SVG file format.
import seaborn as sns
from nutil.plot import paperStyle

# Font-size 8 pt by default,
# text editable
# and seaborn white style with ticks
with paperStyle():
    plt.figure(figsize=(3,2))
    plt.plot(np.random.randn(100))
    plt.xlabel("Time [au]")
    plt.ylabel("Data [au]")
    sns.despine(trim=True, offset=5)
    plt.savefig("nice_figure.png")
    plt.savefig("nice_figure.svg")
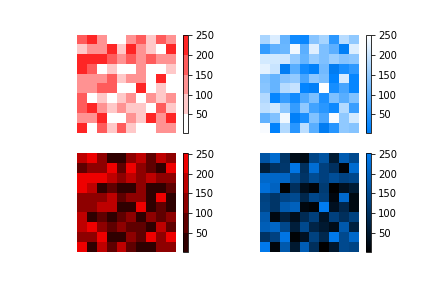
All default sequential colormaps in matplotlib are from white-ish to another color. With the following code you may create your own dark or light-sequential colormaps:
from nutil.plot import darkSequential, lightSequential

im = np.random.randint(0, 255, (10,10))

plt.figure()

plt.subplot(2,2,1)
plt.imshow(im, cmap=lightSequential('#e00',
                                    steps=5,
                                    reverse=True))
plt.colorbar()
plt.axis('off')

plt.subplot(2,2,2)
plt.imshow(im, cmap=lightSequential((0, 124, 241)))
plt.colorbar()
plt.axis('off')

plt.subplot(2,2,3)
plt.imshow(im, cmap=darkSequential('#e00',
                                    steps=5))
plt.colorbar()
plt.axis('off')

plt.subplot(2,2,4)
plt.imshow(im, cmap=darkSequential((0, 124, 241)))
plt.colorbar()
plt.axis('off')

plt.savefig("custom_colormaps.png")
Moving square
from nutil.fake import movingSquare
ms = movingSquare()


