This project defines a framework for the analysis of perceived risk in the interaction between pedestrian and vehicle, from the perspective of the driver using a crowdsourcing approach. The jsPsych framework is used to for the frontend. In the description below, it is assumed that the repo is stored in the folder crossing-crowdsourcing. Terminal commands lower assume macOS.
Tested with Python 3.8.5. To setup the environment run these two commands in a parent folder of the downloaded repository (replace / with \ and possibly add --user if on Windows:
pip install -e crossing-crowdsourcingwill setup the project as a package accessible in the environment.pip install -r crossing-crowdsourcing/requirements.txtwill install required packages.
For QA, the API key of appen needs to be places in file crossing-crowdsourcing/secret. The file needs to be formatted as crossing-crowdsourcing/secret example.
We use heroku to host the node.js implementation. The demo of the implementation may be viewed here. Implementation supports images and/or videos as stimuli.
In this crowdsourcing survey, participants are watching 35 out of a total of 86 videos, that include interactions of a vehicle with pedestrian, from the perspective of the driver. During these videos, the participants are tasked with pressing the F key on their keyboard when they feel a situation could become risky.
 .
.
An example of one of the videos included in the crowdsourcing survey
Data from heroku is filtered based on the following criteria:
- People who made more than
config.allowed_mistakes_signs mistakesin the meaning of traffic signs. - People of which the results had deviating video lengths in more than
config.allowed_stimuli_wrong_durationof the time, or who had data on less thanconfig.num_stimuli_participantvideos available.
We use appen to run a crowdsourcing job. You need to create a client account to be able to create a launch crowdsourcing job. Preview of the appen job used in this experiment is available here.
Data from appen is filtered based on the following criteria:
- People who did not read instructions.
- People who are younger than 18 years of age.
- People who completed the study in under
config.allowed_min_time. - People who completed the study from the same IP more than once (the 1st data entry is retained).
- People who used the same
worker_codemultiple times. One of the disadvantages of crowdsourcing is having to deal with workers that accept and do crowdsourcing jobs just for money (i.e.,cheaters). The framework offers filtering mechanisms to remove data from such people from the dataset used for the analysis. Cheaters can be reported from thecrossing.analysis.QAclass. It also rejects rows of data from cheaters in appen data and triggers appen to acquire more data to replace the filtered rows.
Data from appen is anonymised in the following way:
- IP addresses are assigned to a mask starting from
0.0.0.0and incrementing by 1 for each unique IP address (e.g., the 257th IP address would be masked as0.0.0.256). - IDs are anonymised by subtracting the given ID from
config.mask_id.
Analysis can be started by running python crossing-crowdsourcing/crossing/run.py. A number of CSV files used for data processing are saved in crossing-crowdsourcing/_output. Visualisations of all data are saved in crossing-crowdsourcing/_output/figures/.
All static figures below link to their corresponding dynamic and clickable versions in html format.

Visualisation of how dynamic variables (keypresses, objects, velocity) change over time.

Correlation matrix.

Scatter matrix.
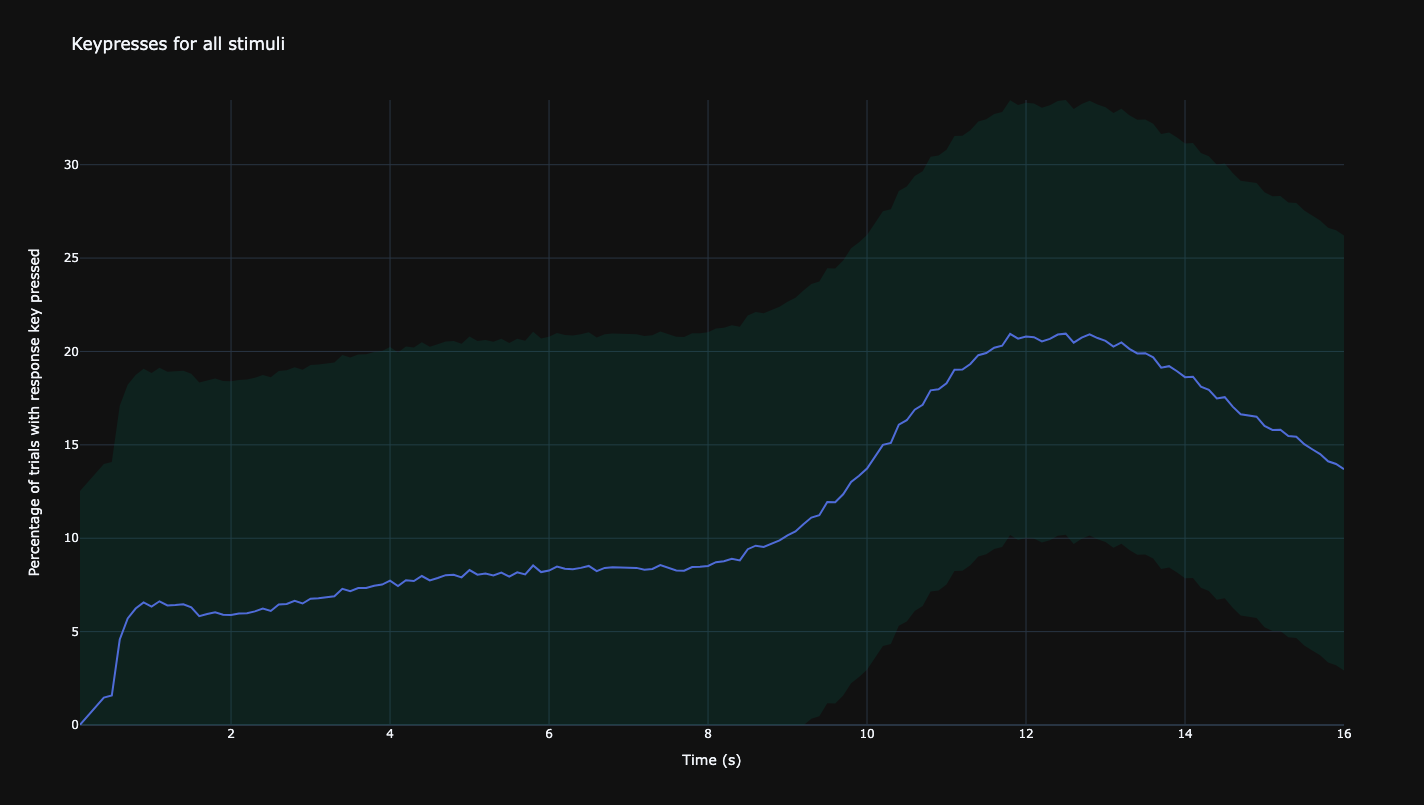
Average keypresses for all videos.
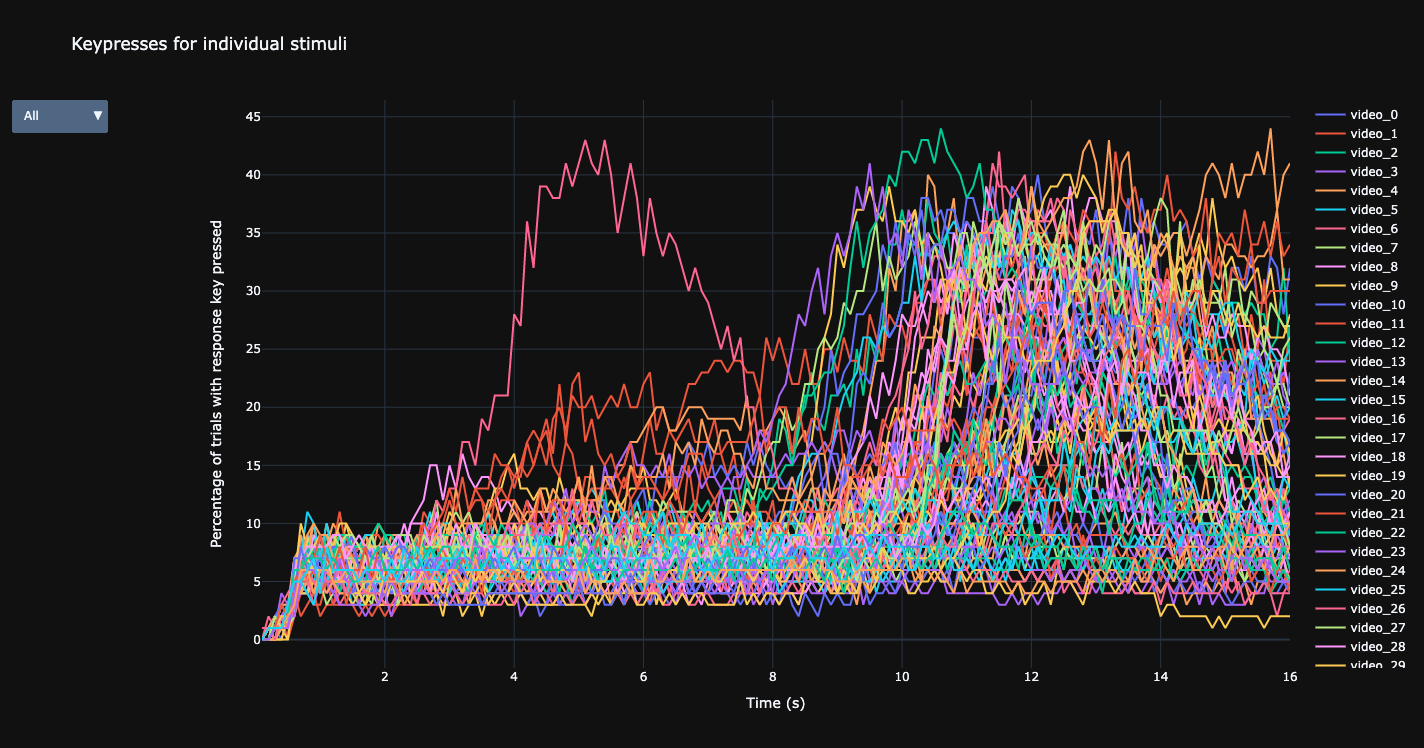
Individual keypresses for all videos.
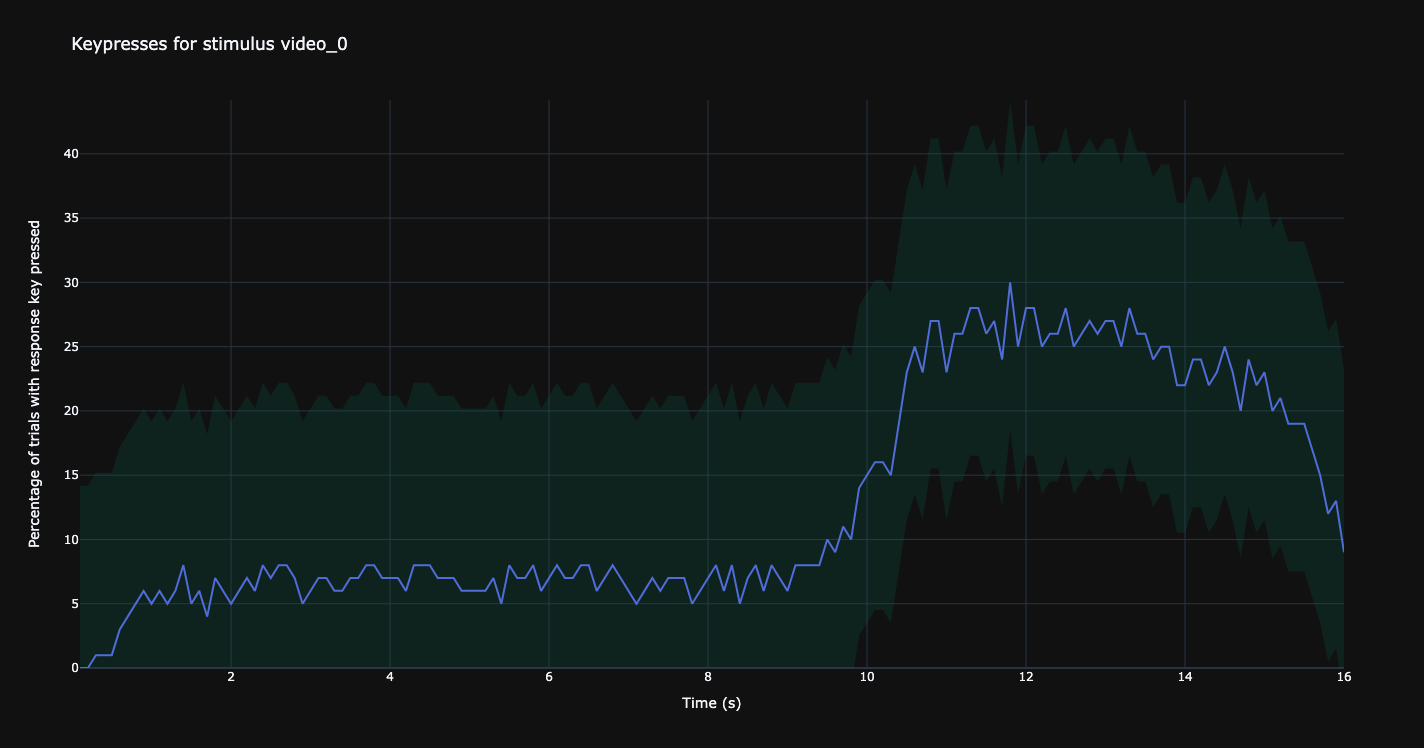
Keypresses for a selected video (video_0).
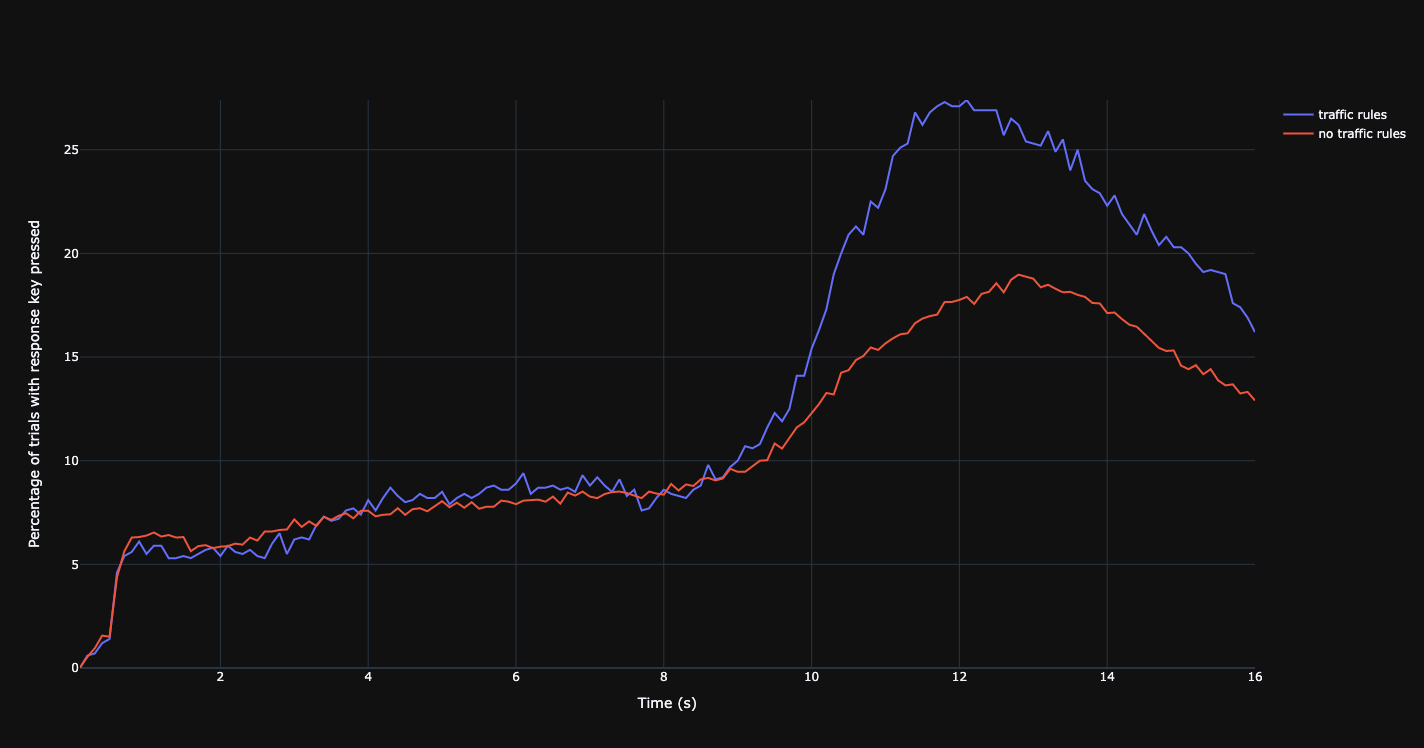
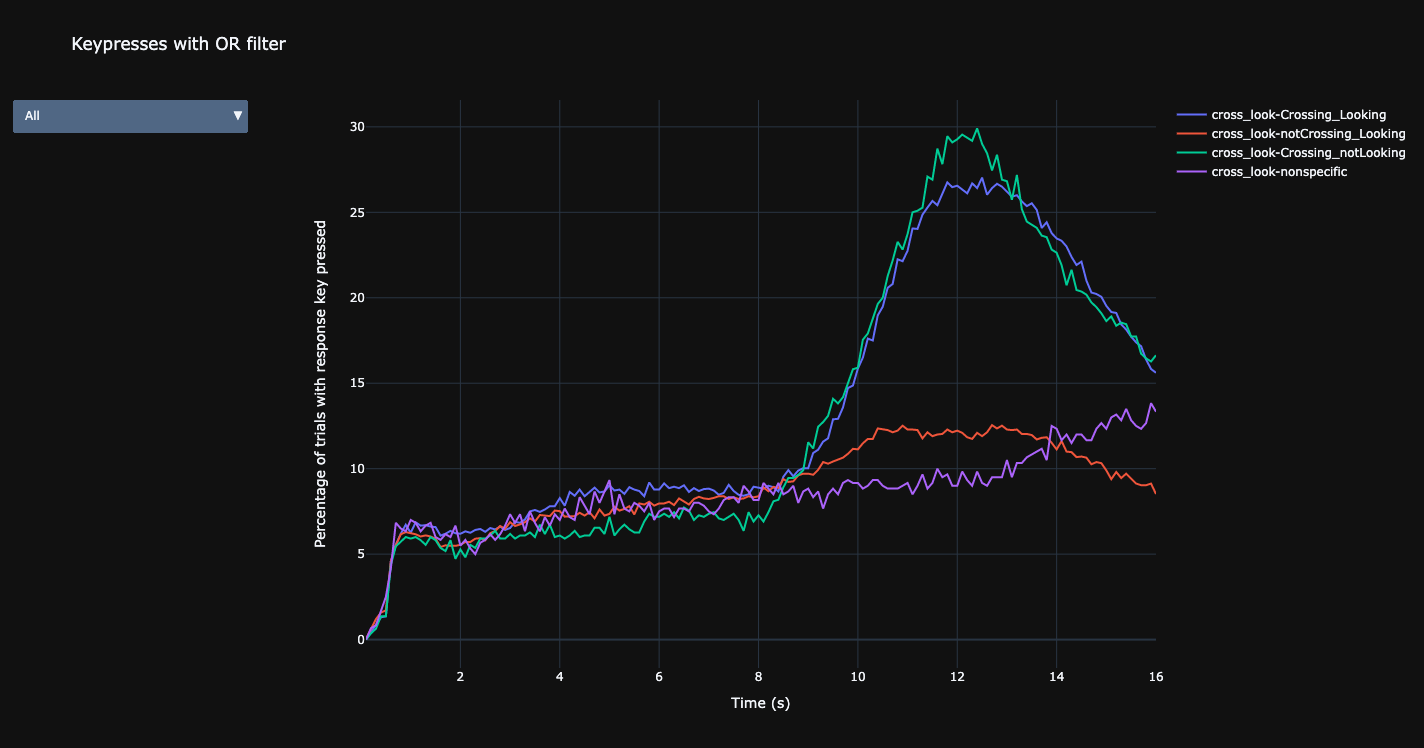
Keypresses in relation to traffic rules.
Keypresses in relation to the traffic signs.
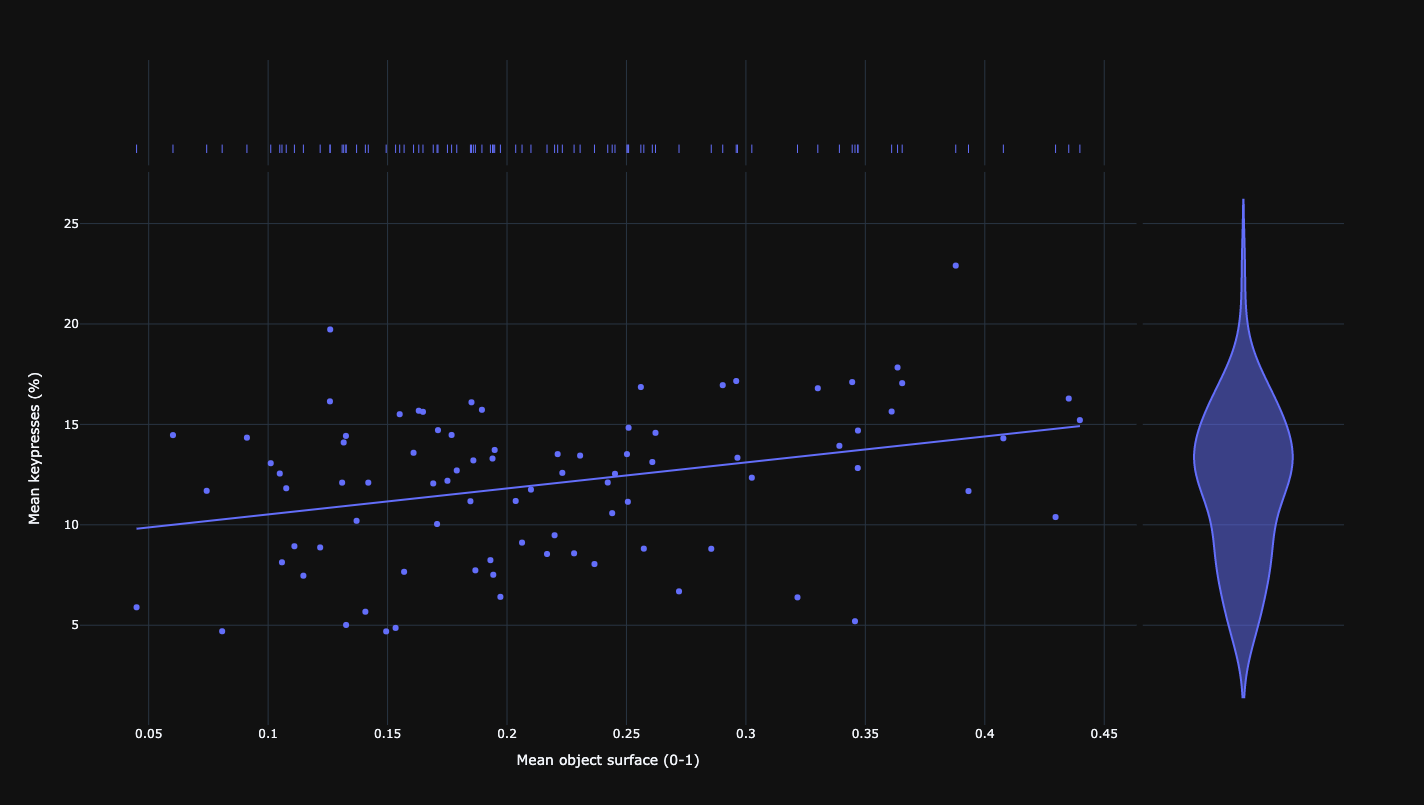
Relationship between mean keypresses of participants and mean surface area of objects.
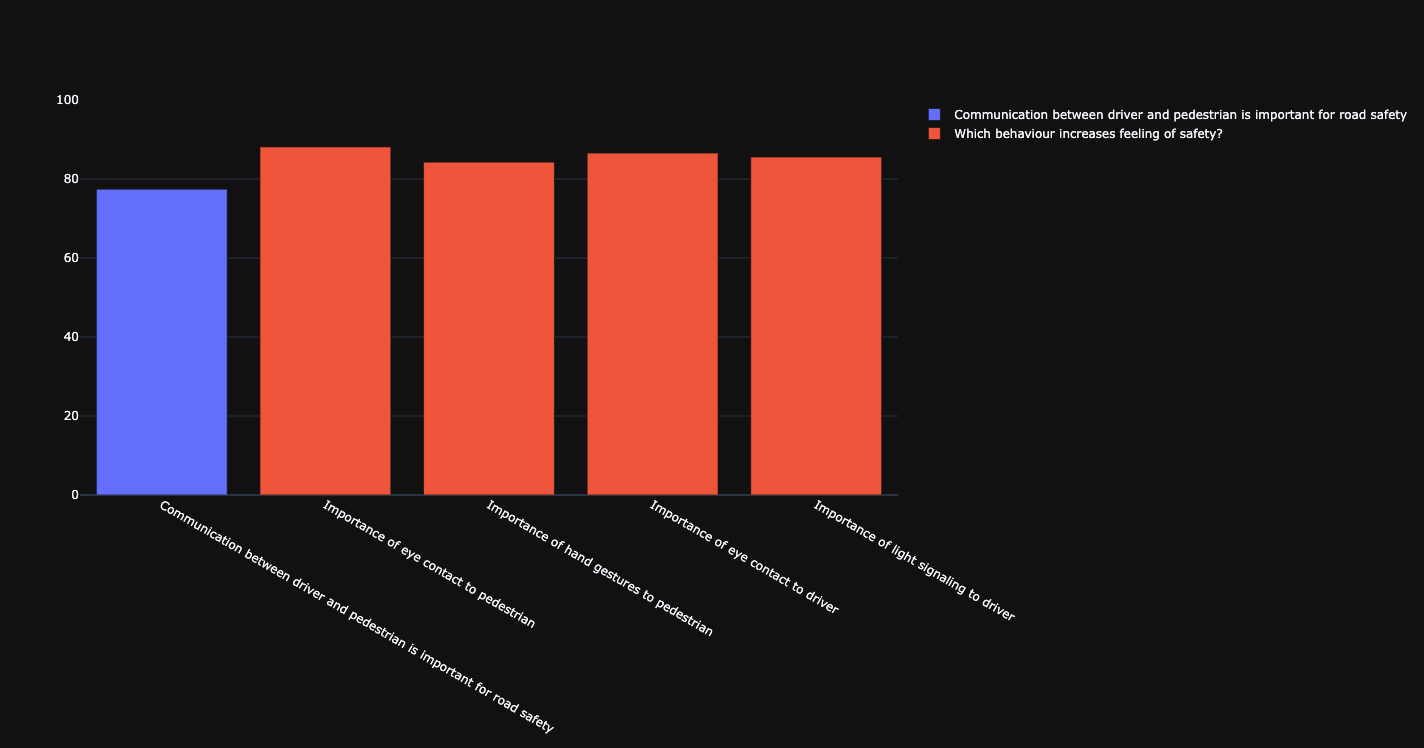
Communication.
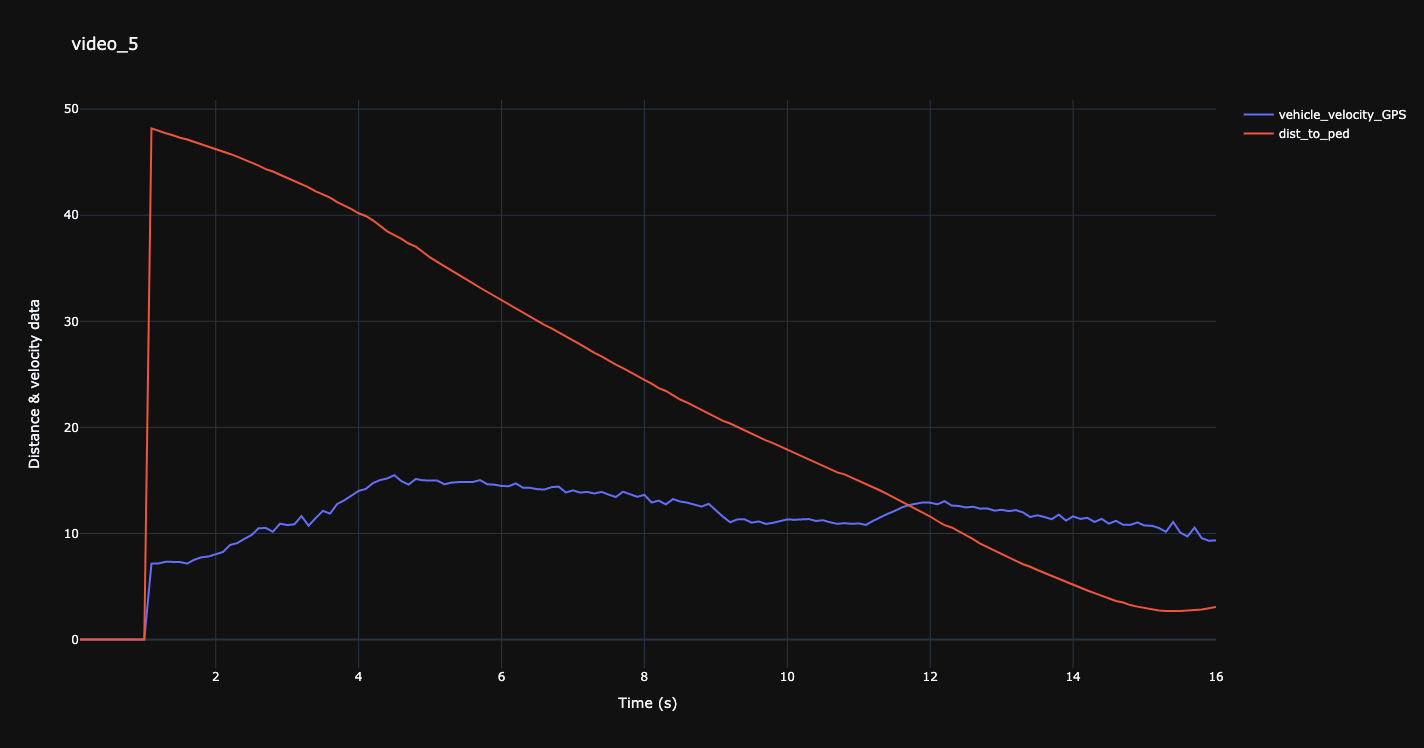
Distance to pedestrian over speed for a selected video (video_5).
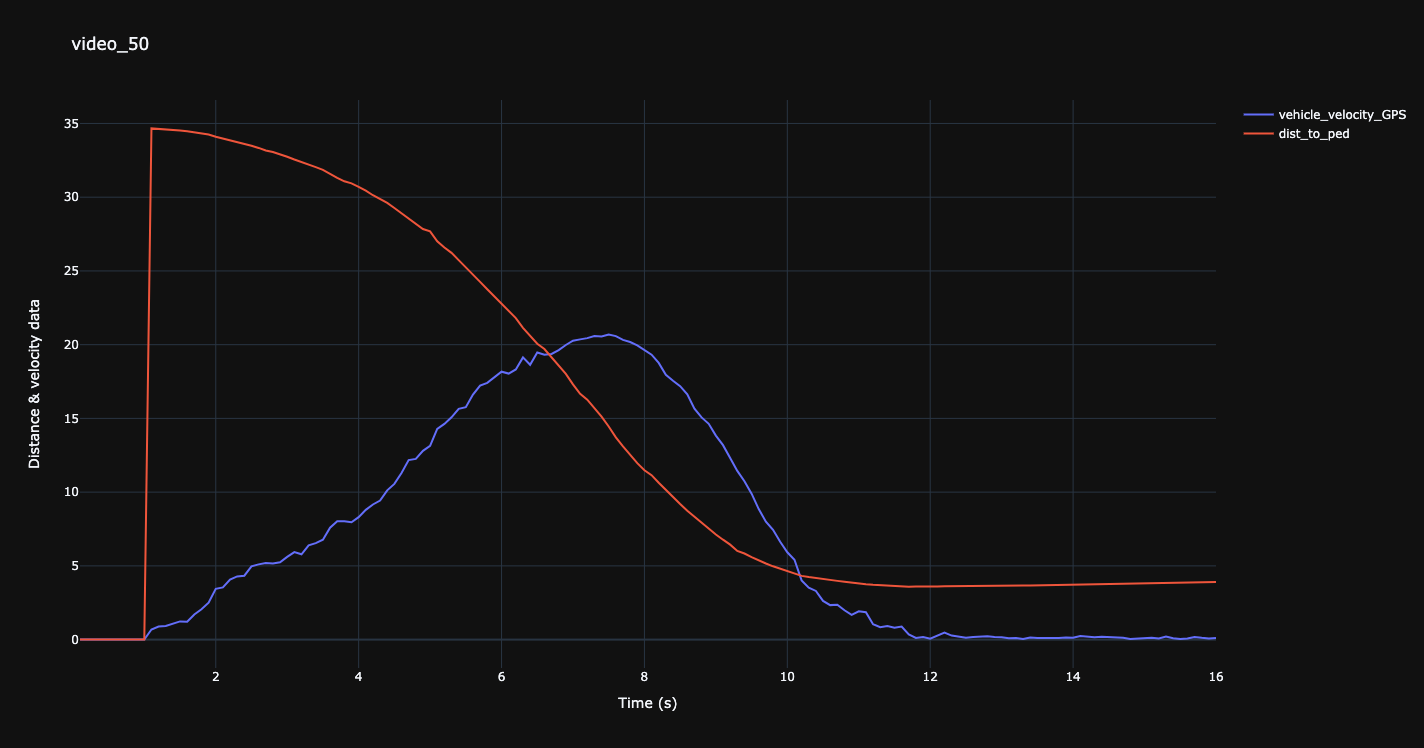
Distance to pedestrian over speed for a selected video (video_50).
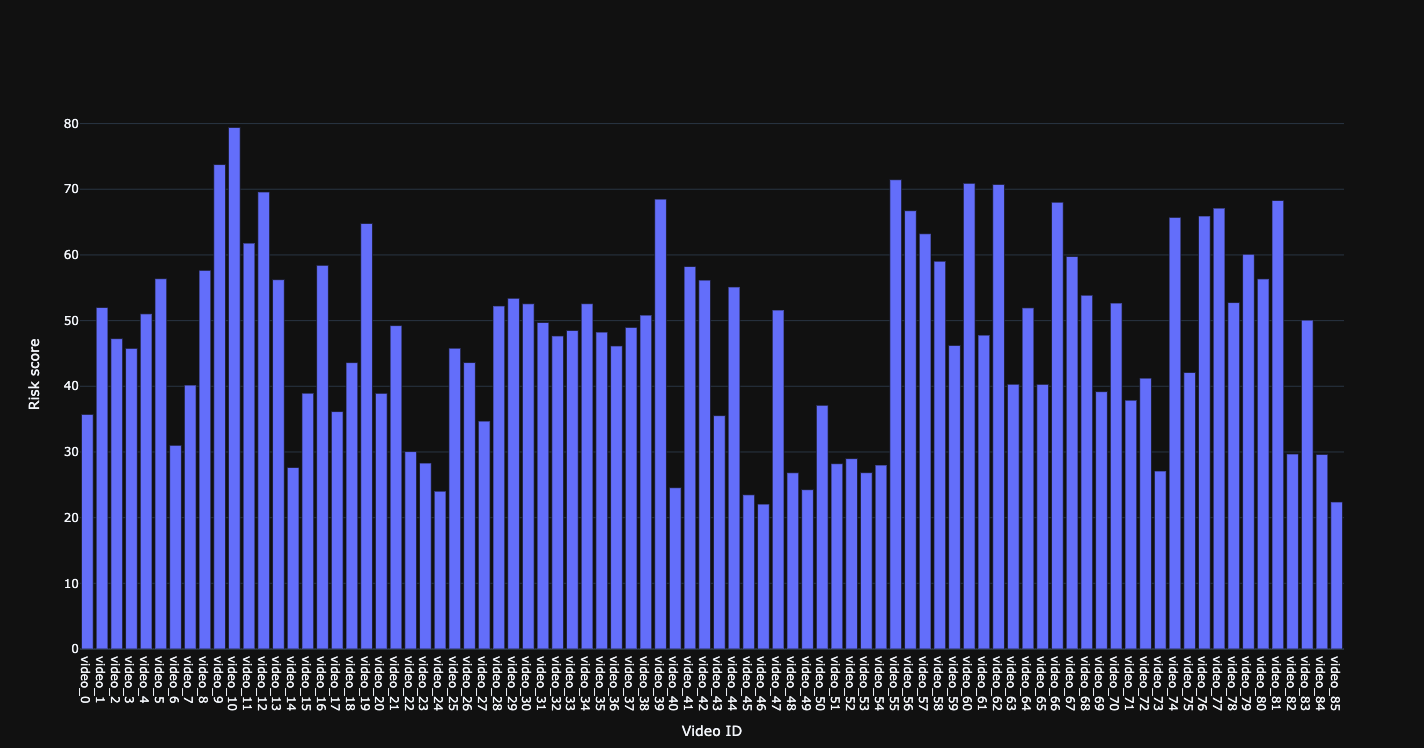
Risk score for individual videos.
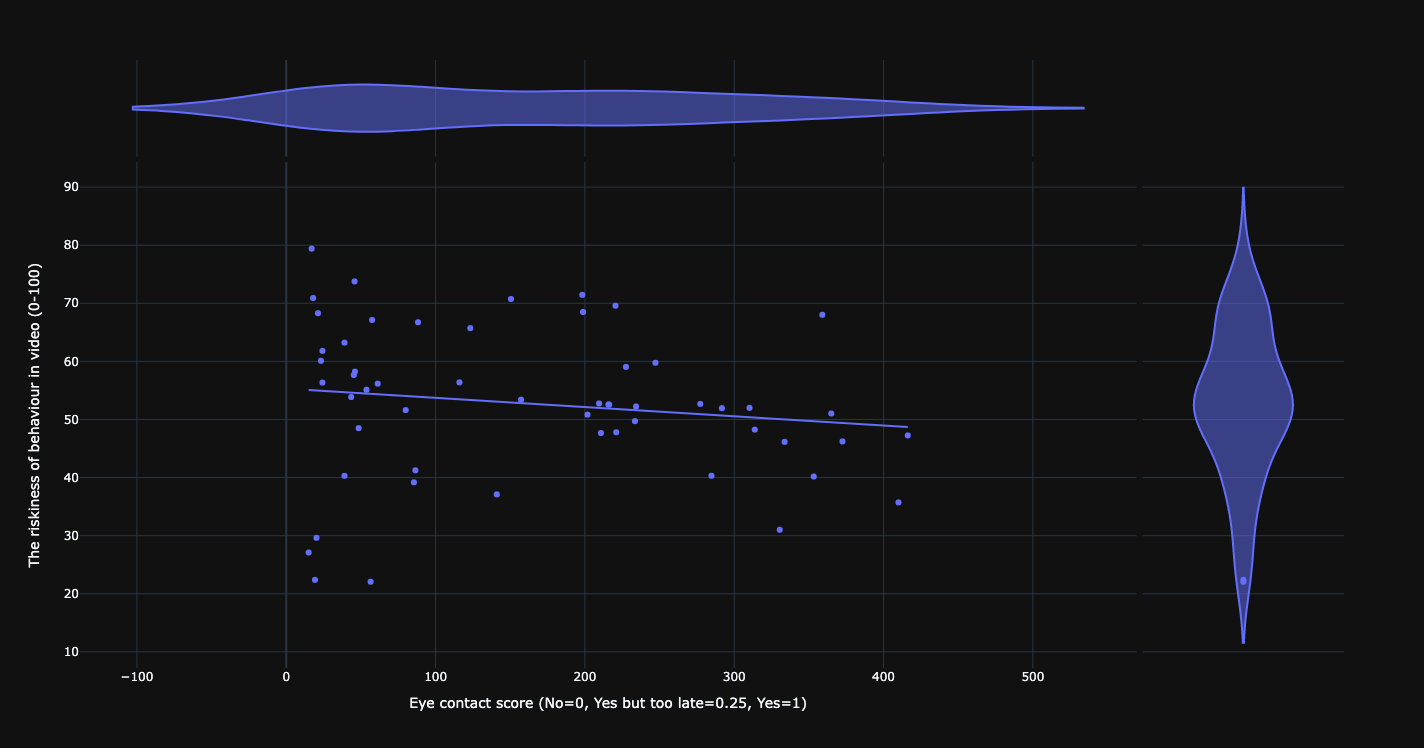
Relationship between eye contact and risk score.
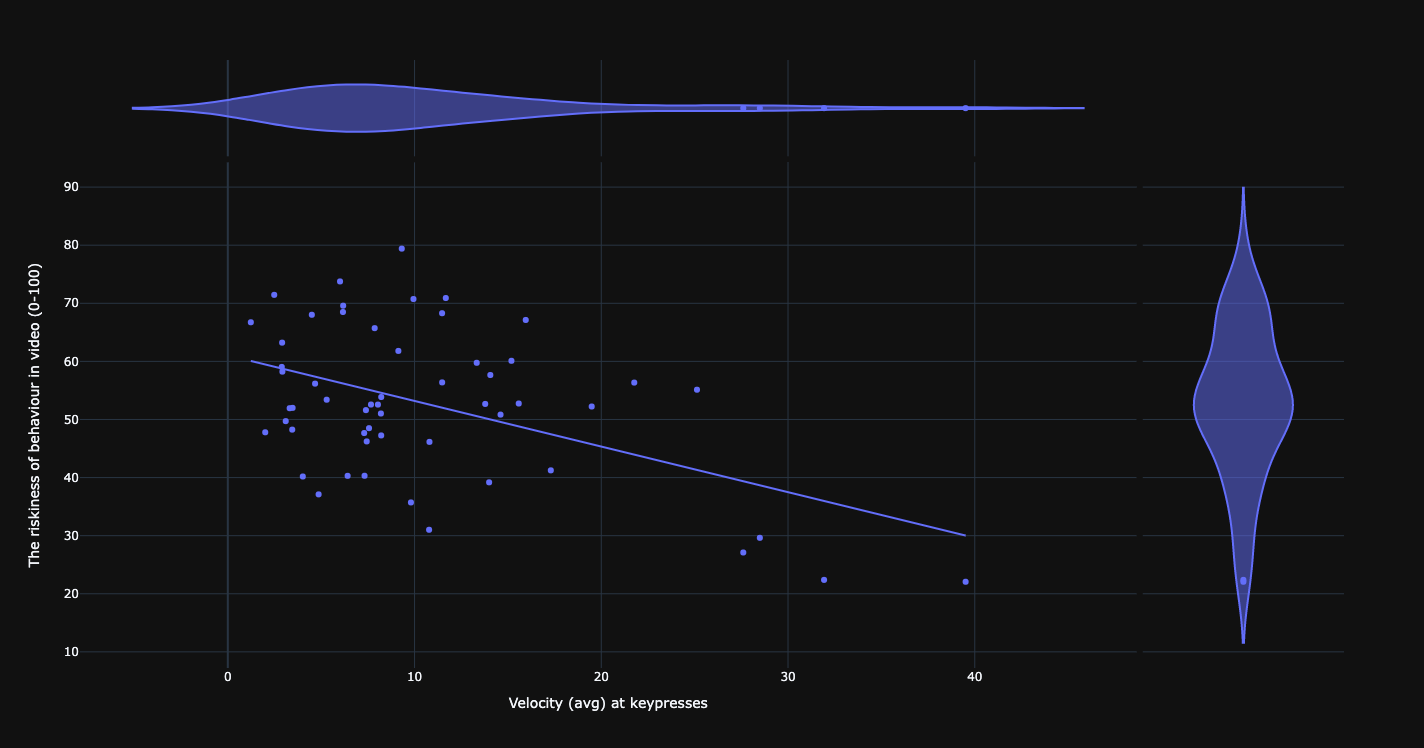
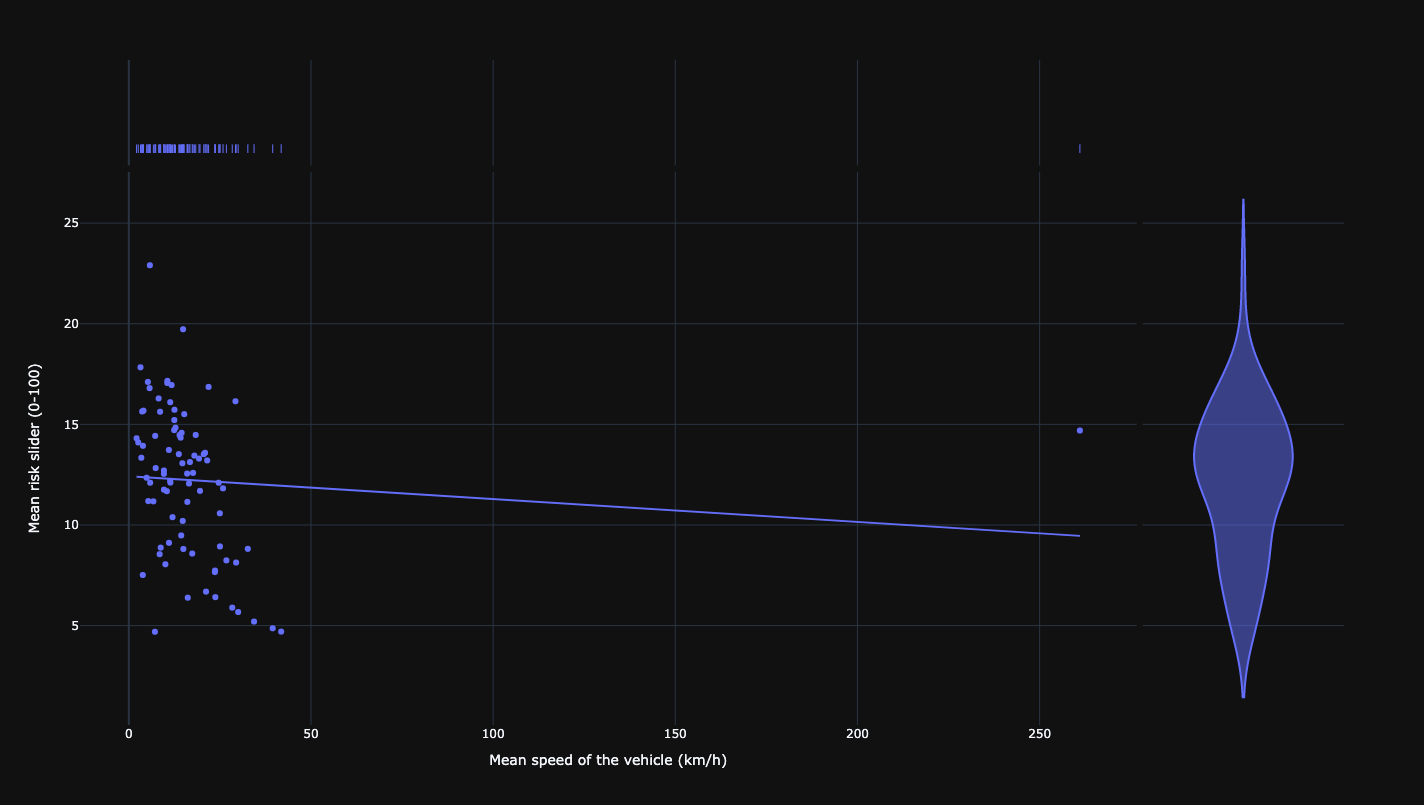
Relationship between car velocity and risk score.
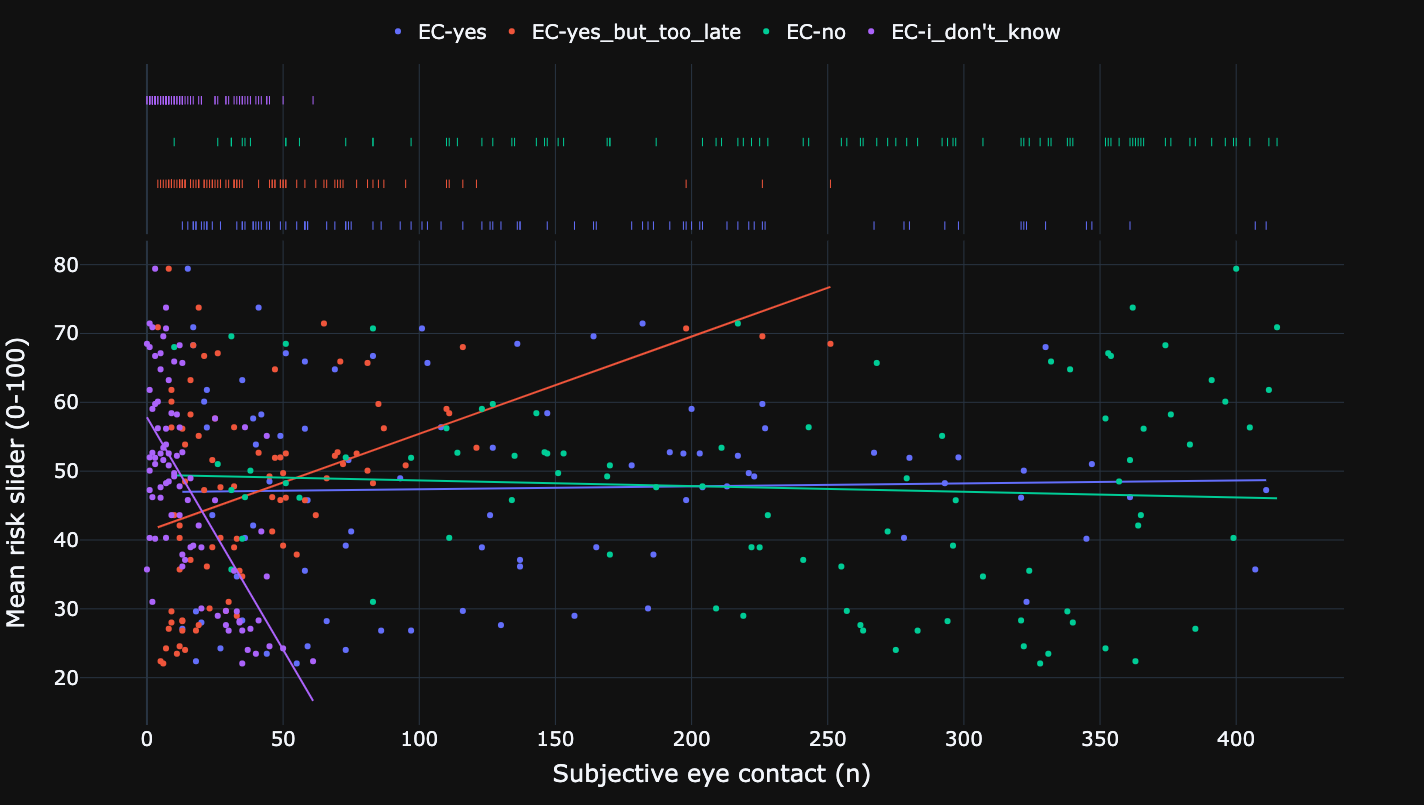
Relationship between mean risk and values of subjective eye contact.
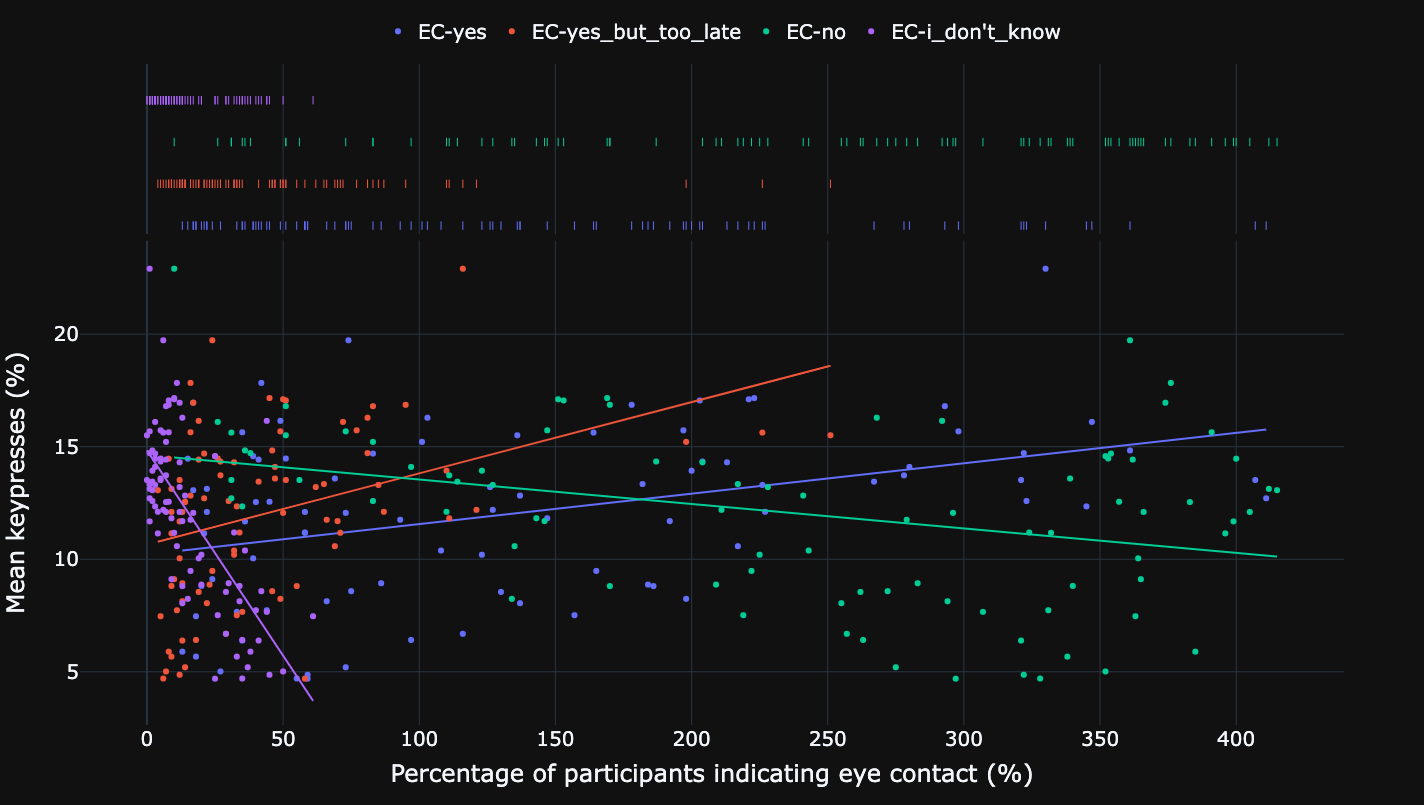
Relationship between mean risk and percentage of participants indicating eye contact.
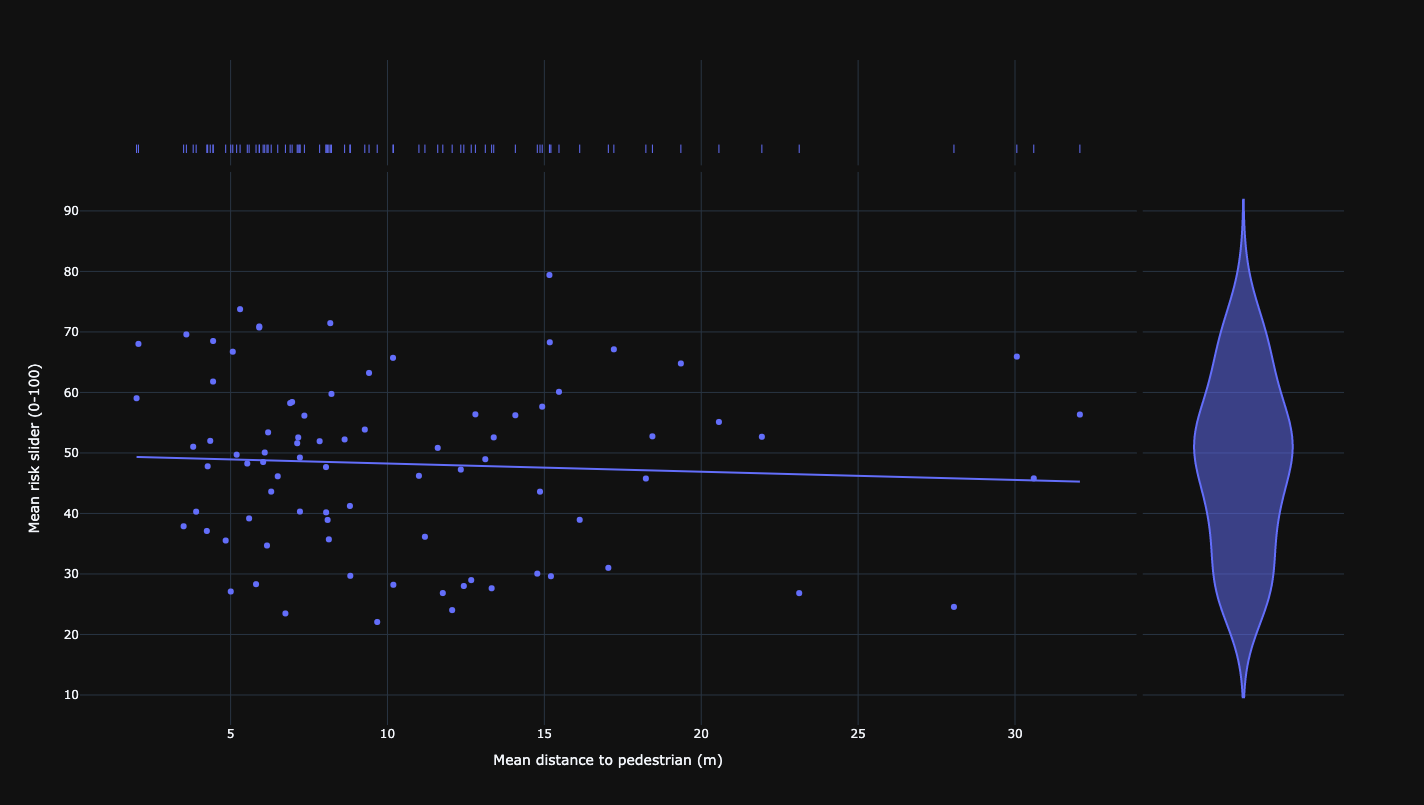
Relationship between mean risk and mean distance to pedestrian.
Relationship between mean risk and mean distance to pedestrian.
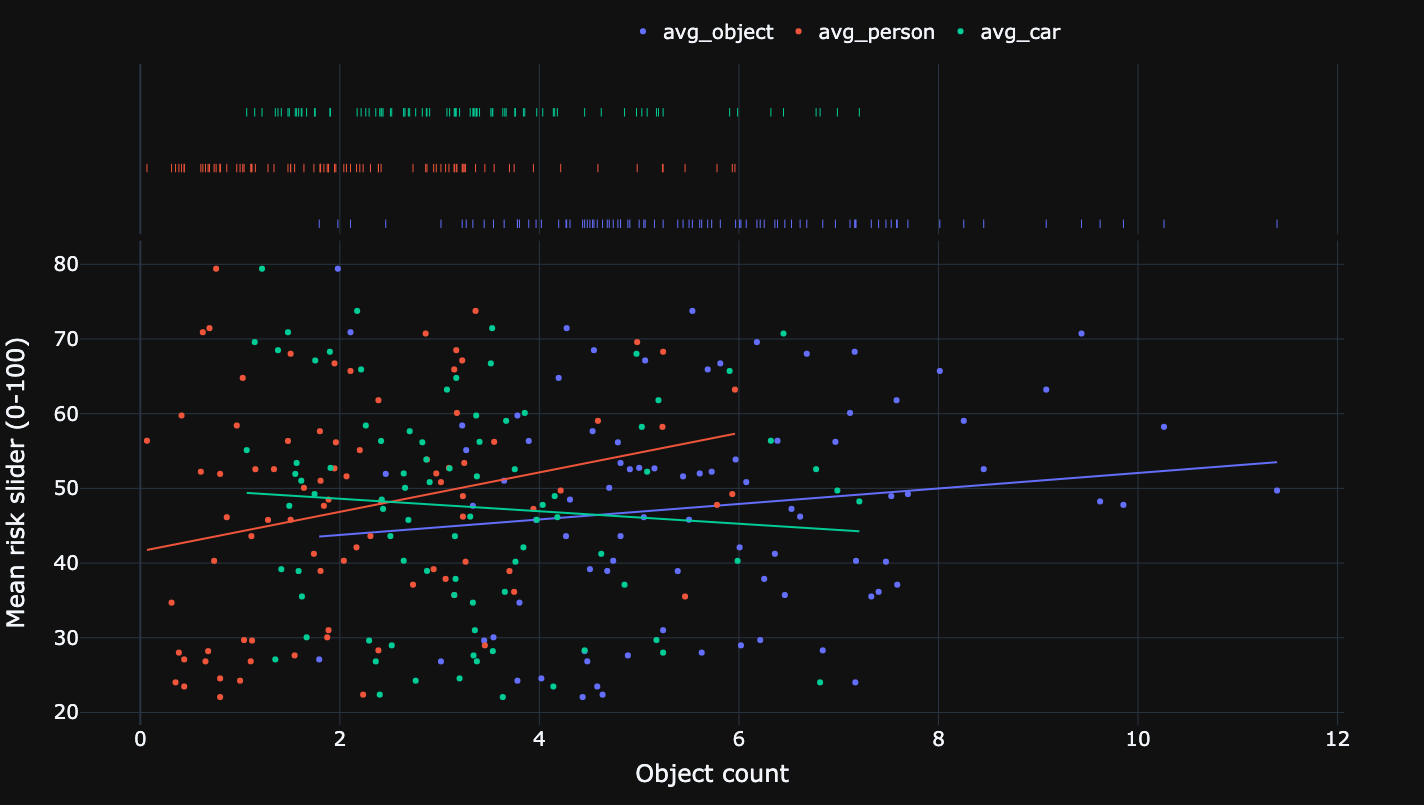
Relationship between mean risk and mean number of objects.
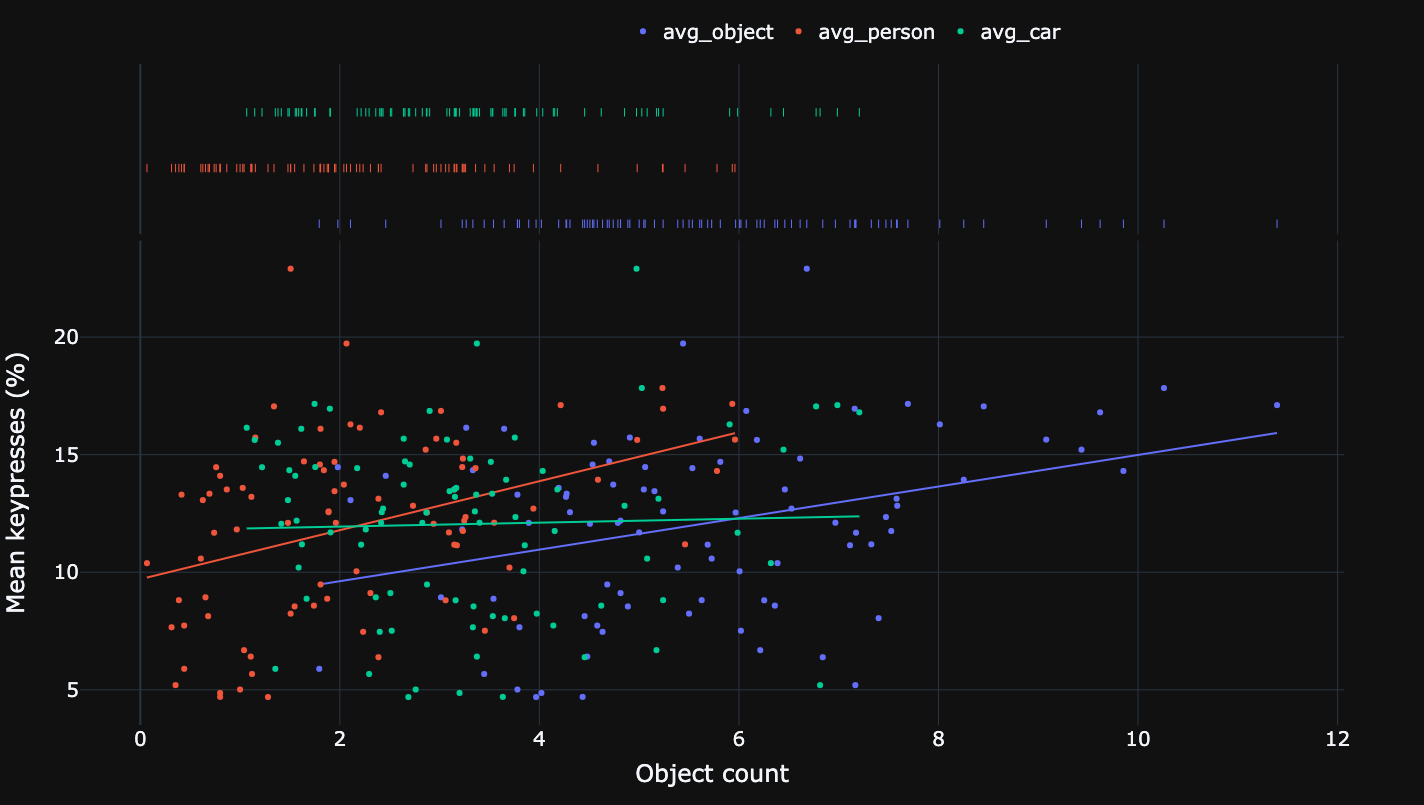
Relationship between mean risk and mean keypresses of participants.
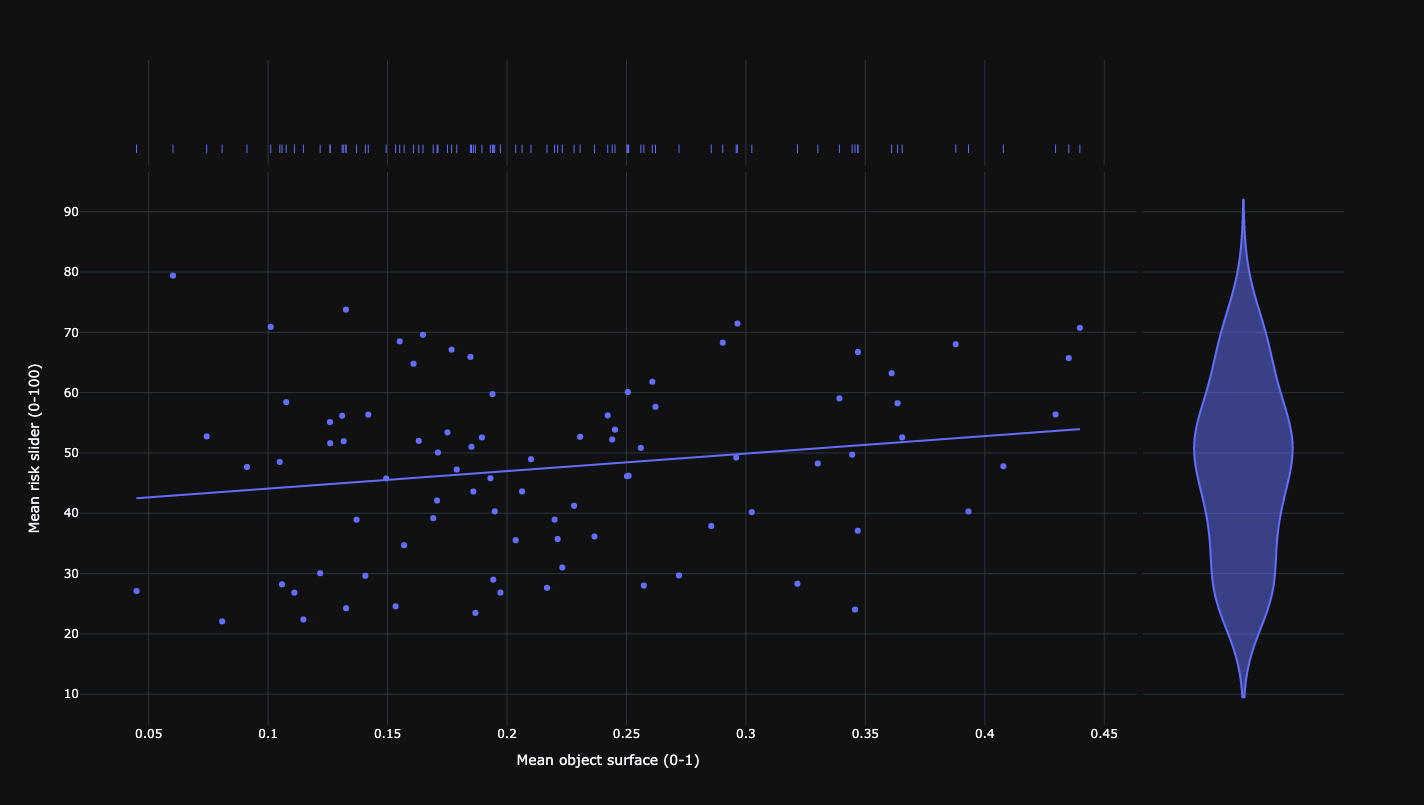
Relationship between mean risk and mean surface area of objects.
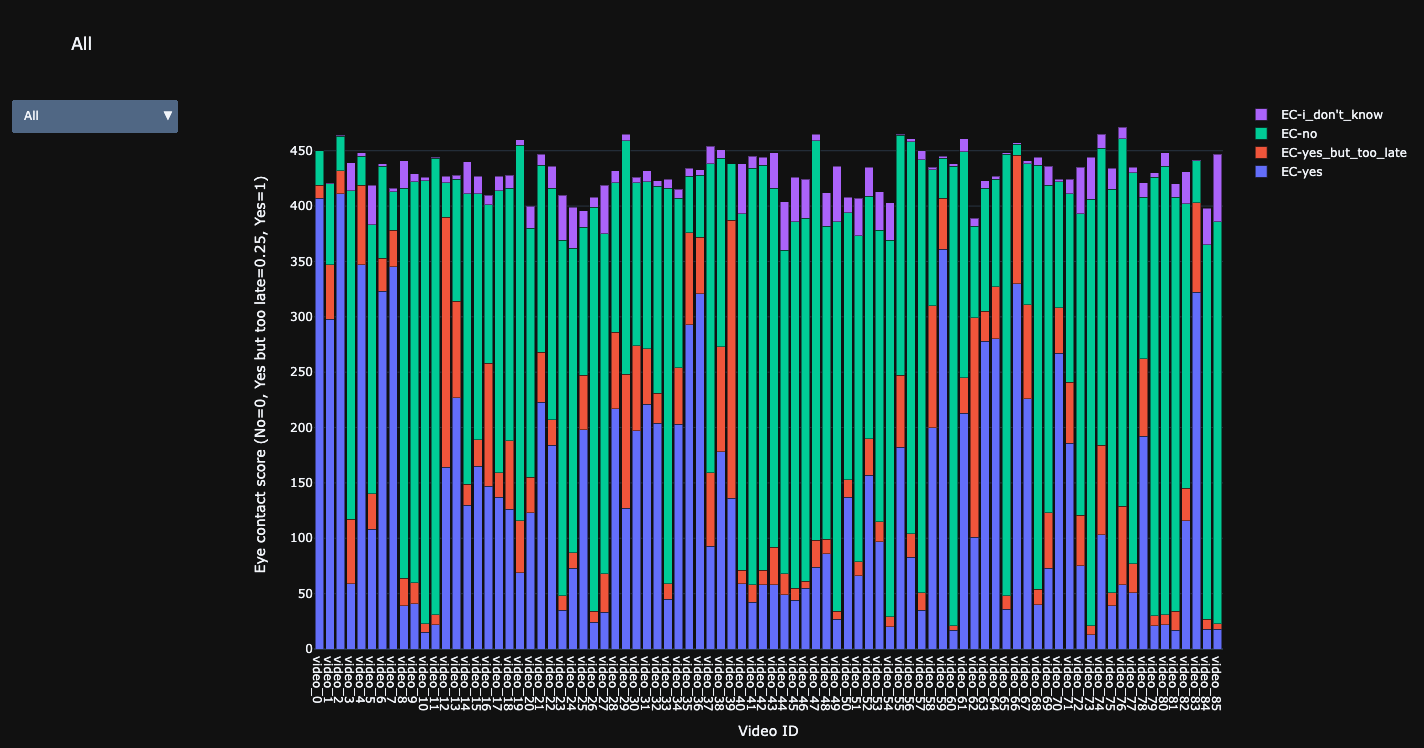
Eye contact score.
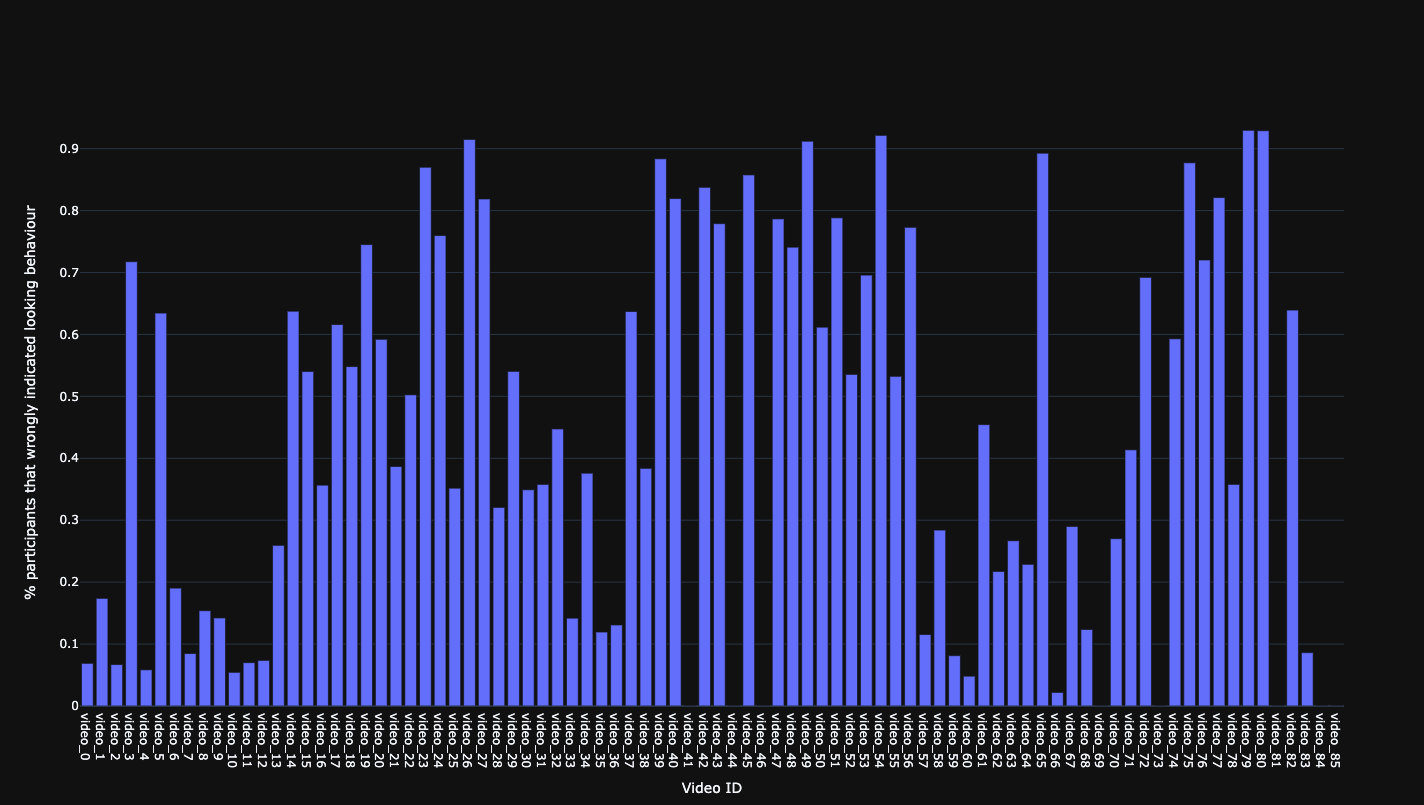
Percentage of participants that wrongly indicated looking behaviour.
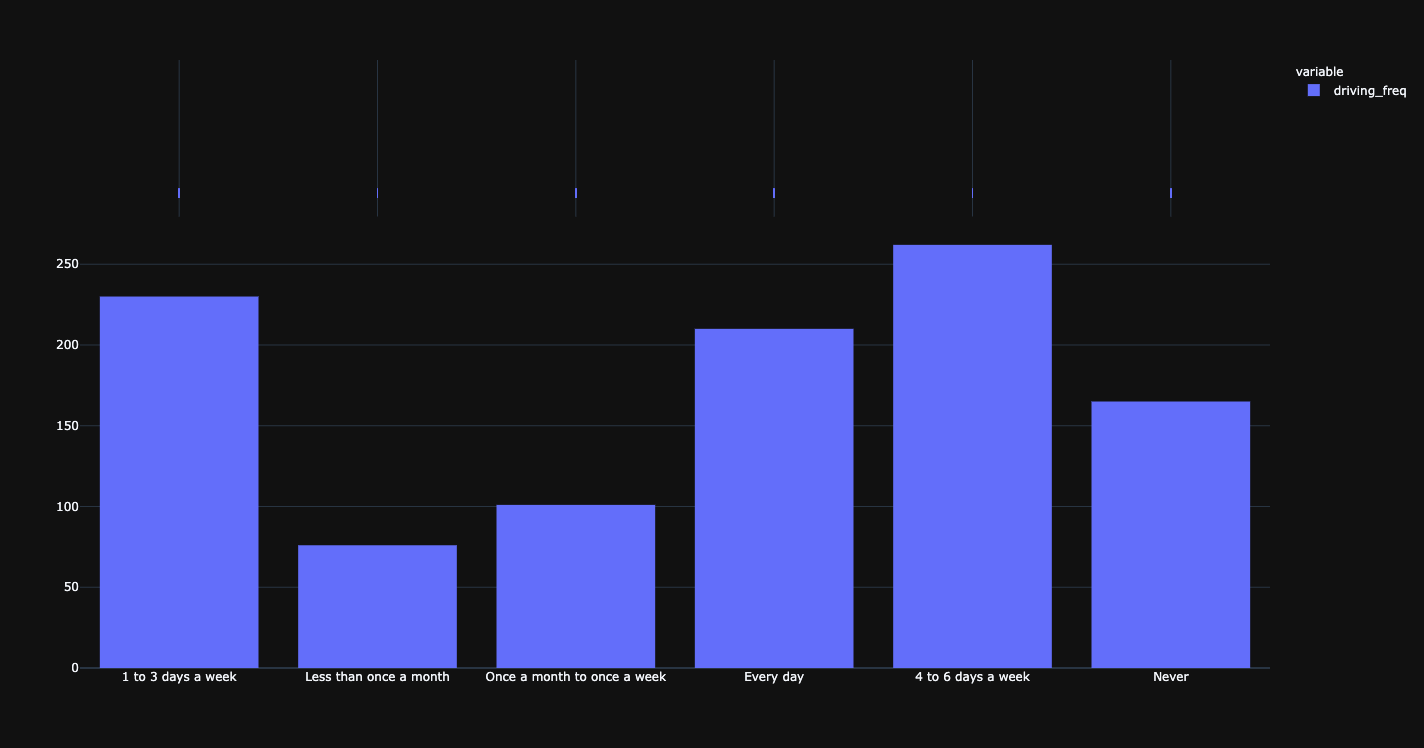
Driving frequency.
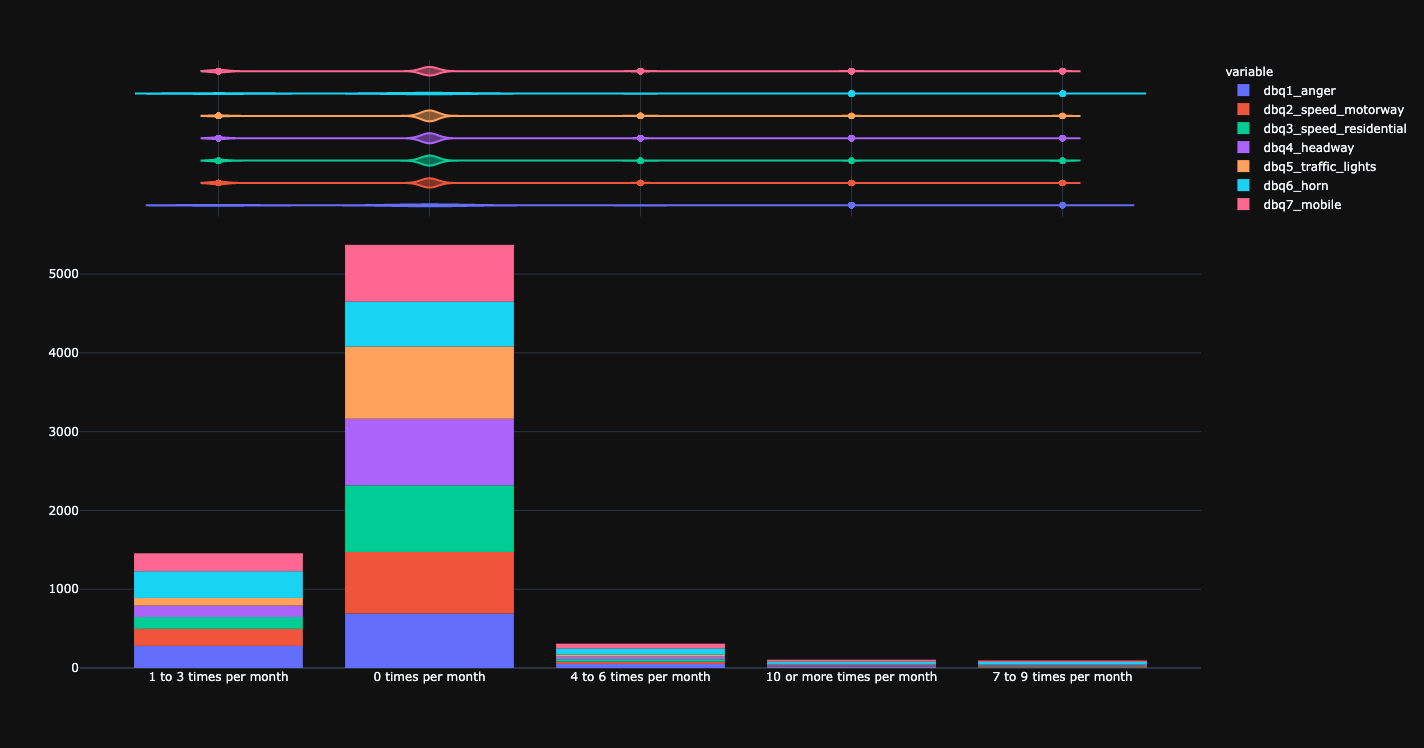
Driving behaviour questionnaire (DBQ).
Time of participation.
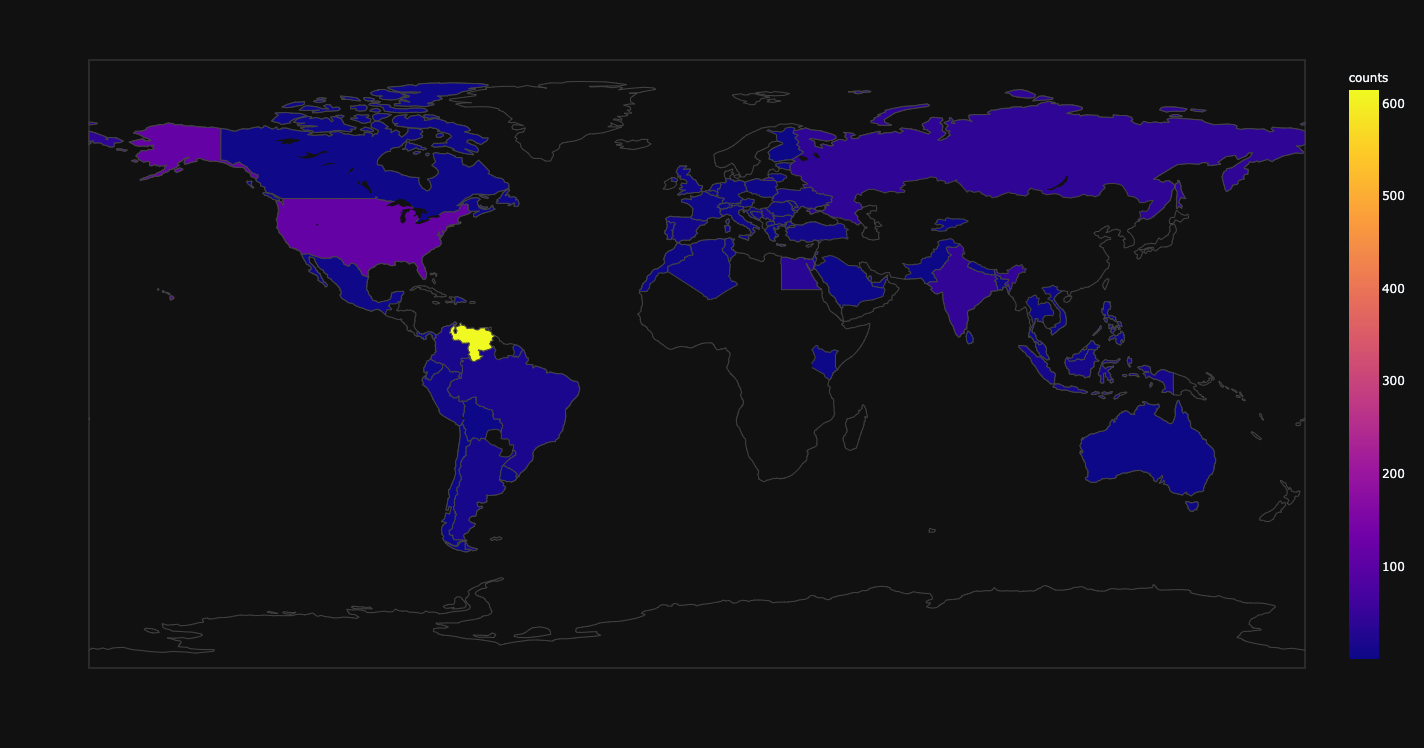
Map of counts of participants.
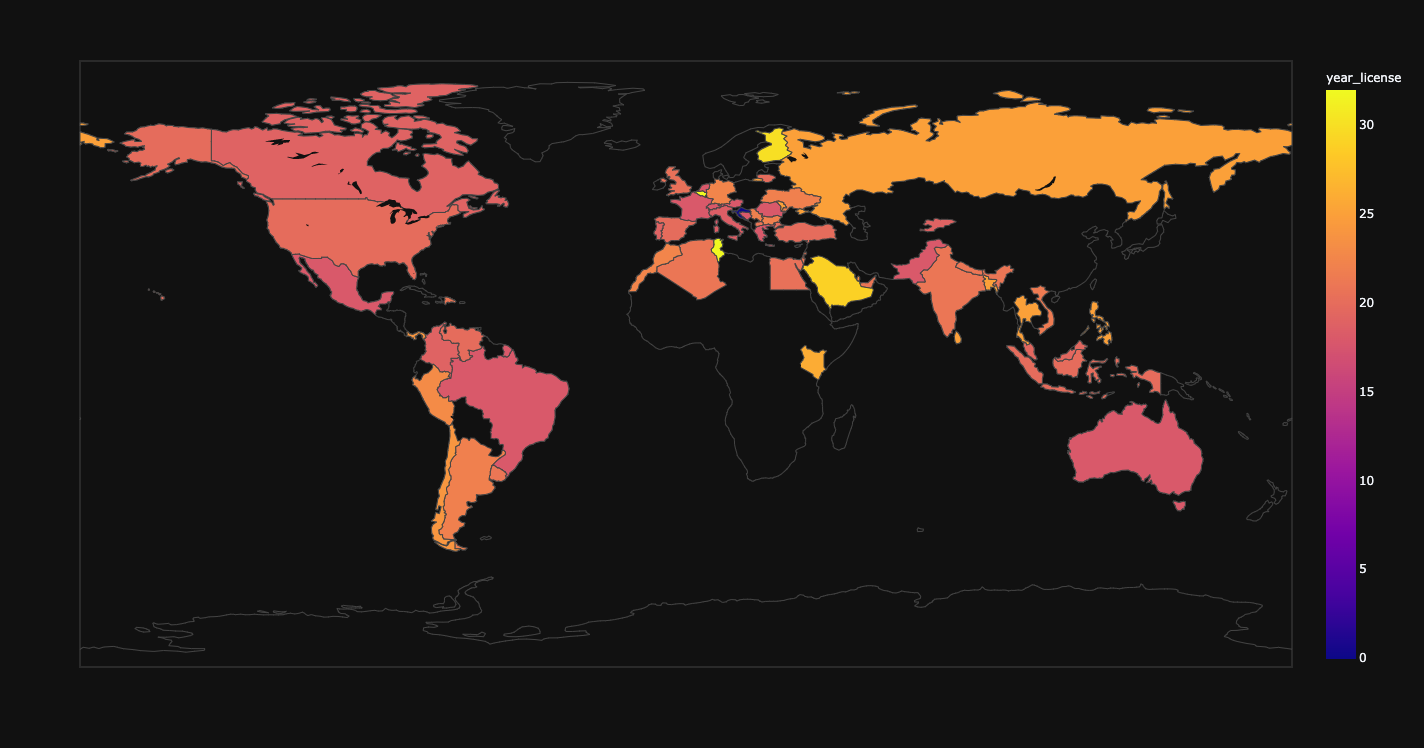
Map of years of having a license.
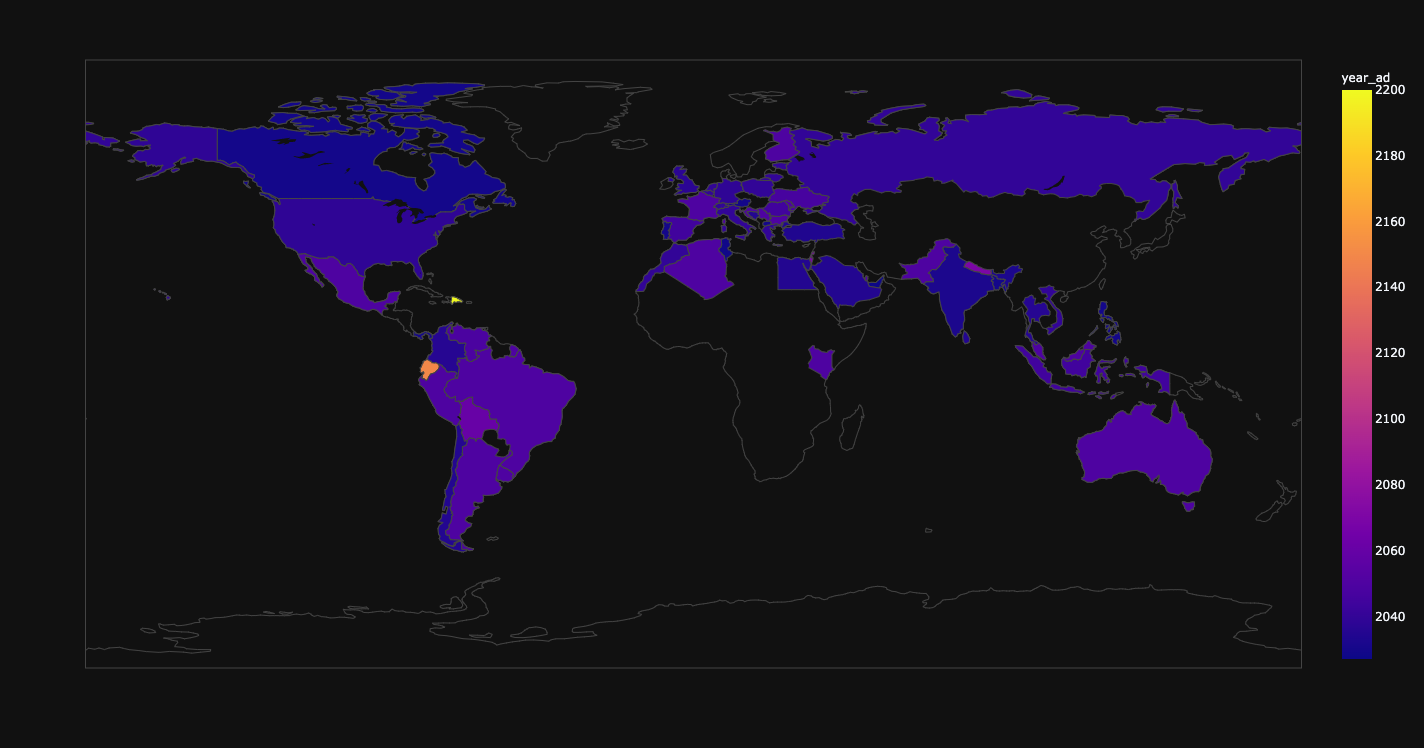
Map of prediction of the year of introduction of automated cars in the country of residence.
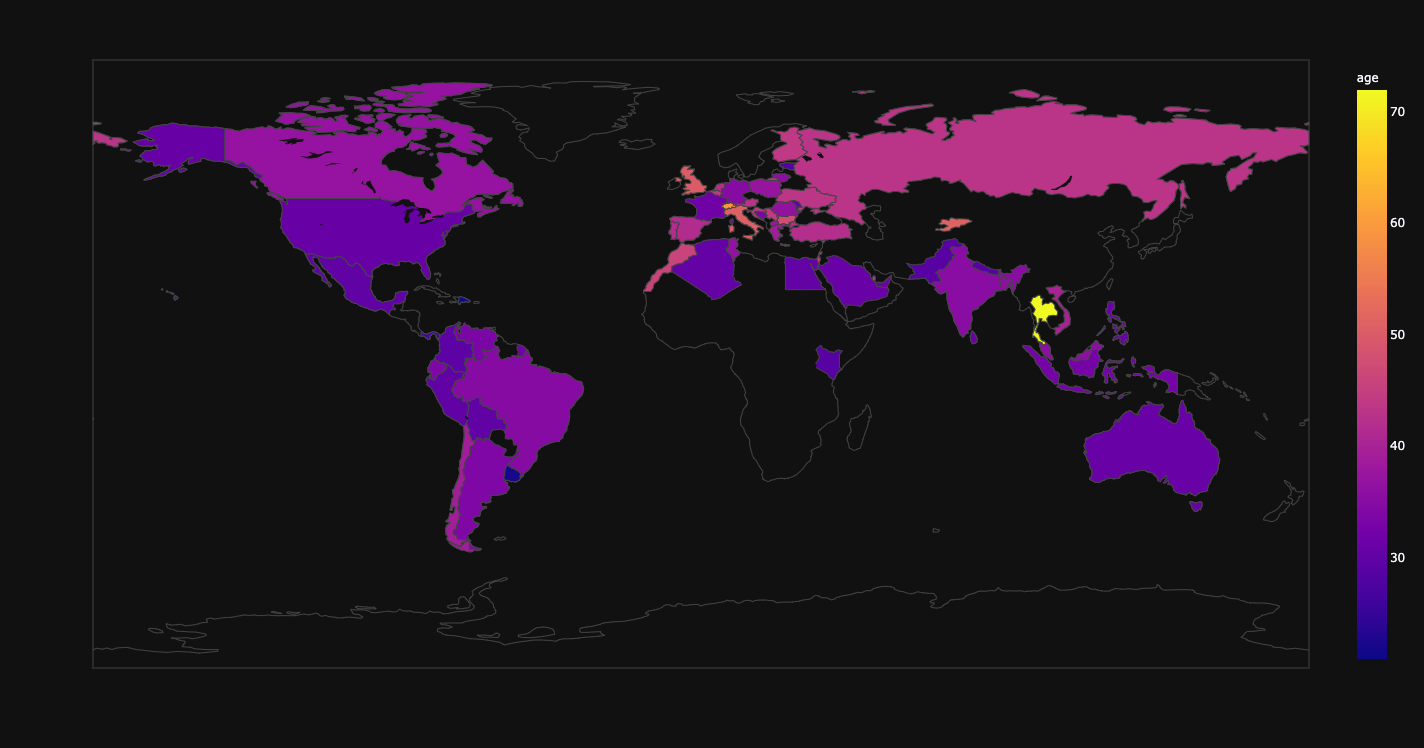
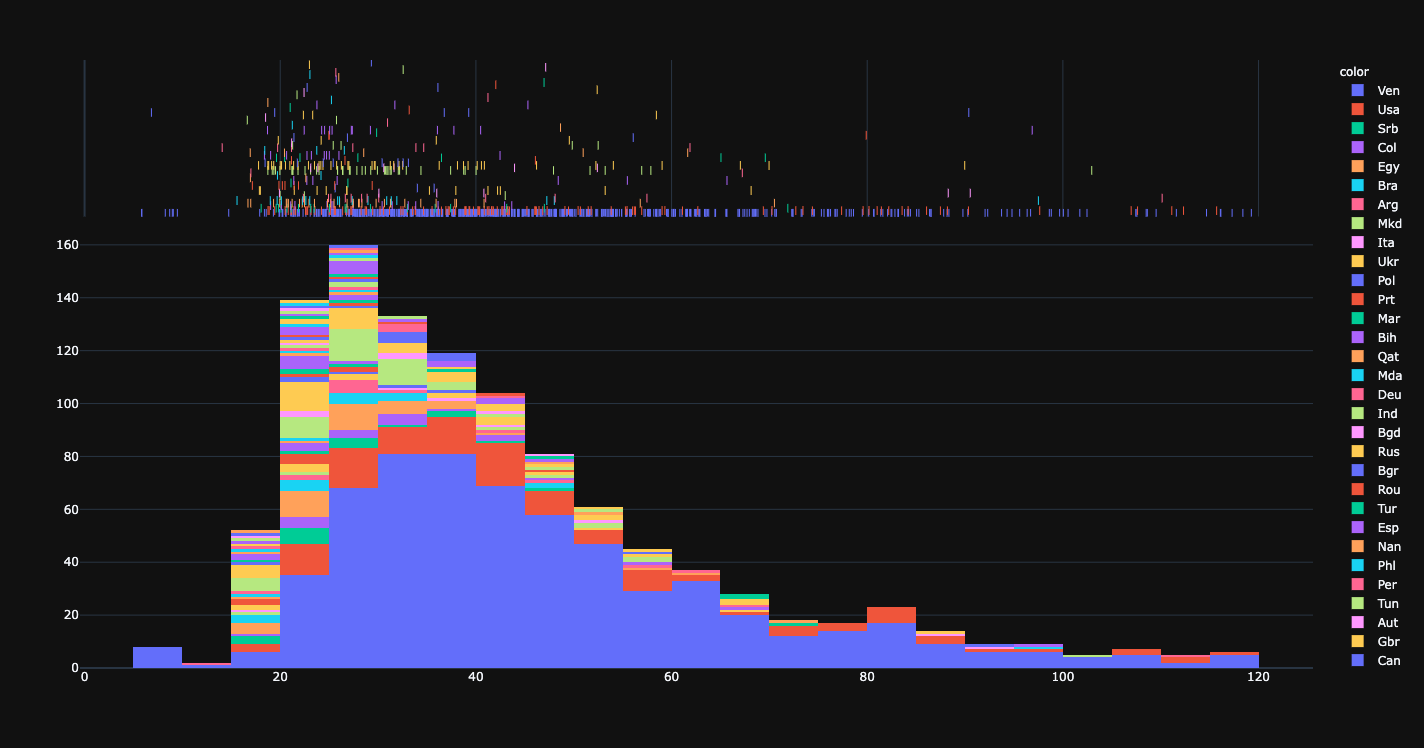
Map of age of participants.
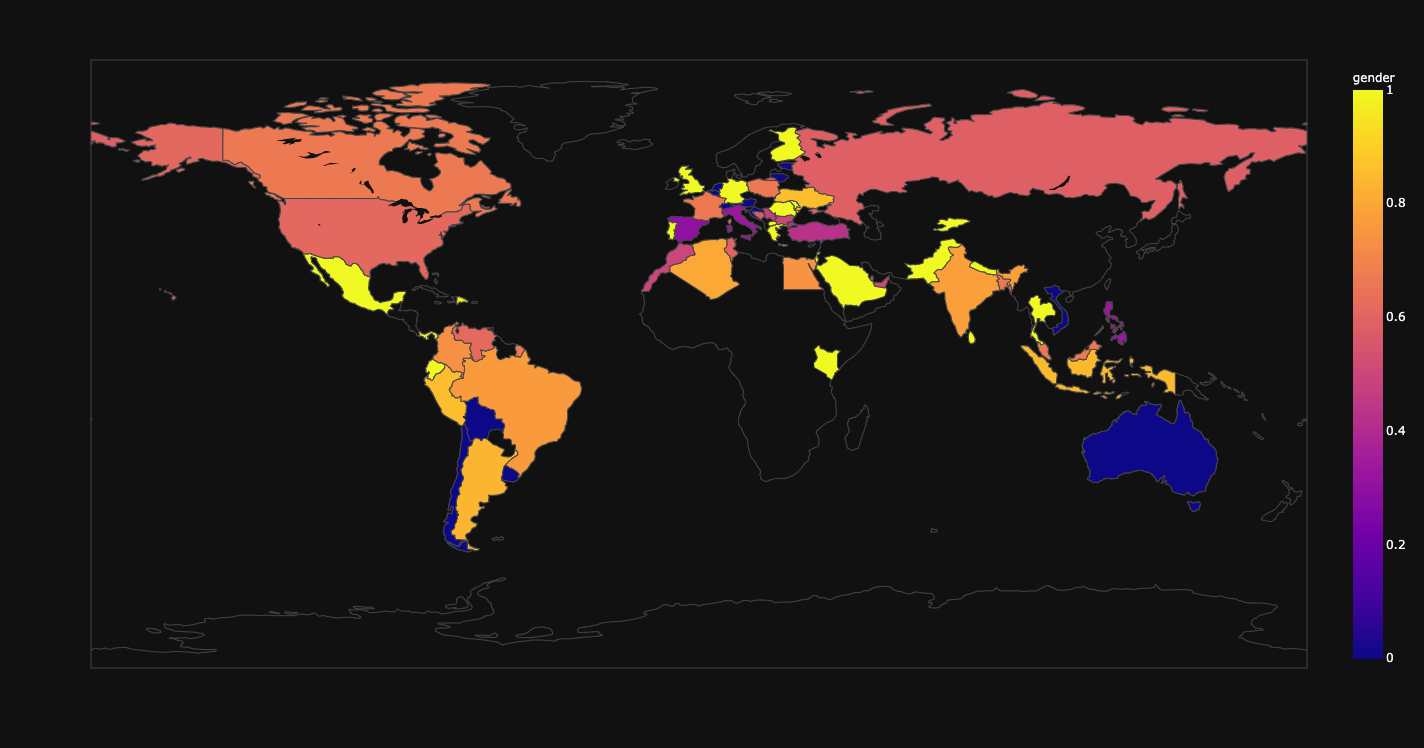
Map of distribution of gender.
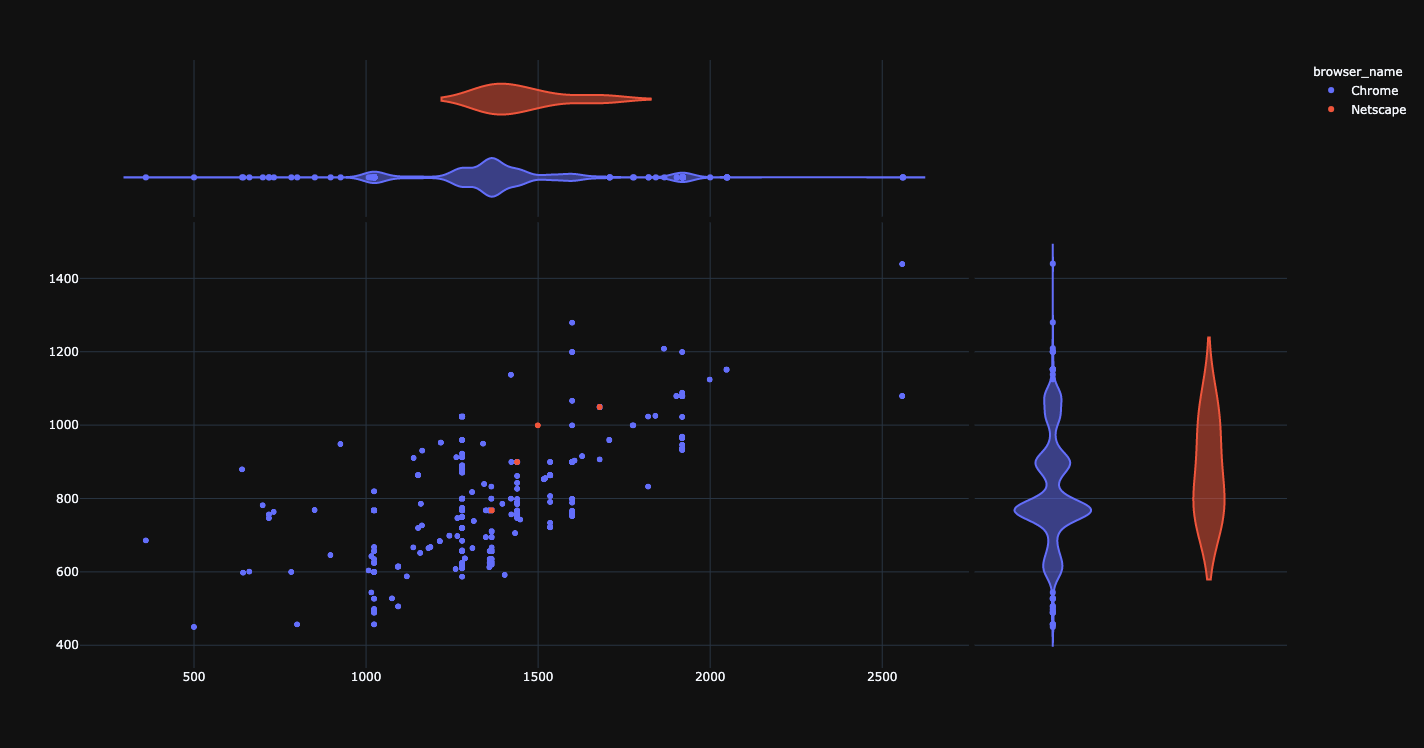
Dimensions of browser.
Configuration of analysis needs to be defined in crossing-crowdsourcing/crossing/config. Please use the default.config file for the required structure of the file. If no custom config file is provided, default.config is used. The config file has the following parameters:
appen_job: ID of the appen job.allowed_min_time: the cut-off for minimal time of participation for filtering.num_stimuli: number of videos in the study.num_stimuli_participant: amount of videos each participant watched.num_repeat: The amount of times the a video was repeated.kp_resolution: bin size in ms in which data is stored.allowed_stimulus_wrong_duration: if the percentage of videos with abnormal length is above this value, exclude participant from analysis.allowed_mistakes_signs: number of allowed mistakes in the questions about traffic signs.sign_answers: answers to the questions on traffic signs.mask_id: number for masking worker IDs in appen data.files_heroku: files with data from heroku.file_appen: file with data from appen.file_cheaters: CSV file with cheaters for flagging.path_stimuli: path consisting of all videos included in the survey.mapping_stimuli: CSV file that contains all data found in the videos.plotly_template: template used to make graphs in the analysis.
If you receive the ValueError: unknown file extension: .mp4 from PIL, install FFMPEG from https://www.ffmpeg.org/download.html. This problem was reported on Windows.