Most notes are organized in a tree. Trees cannot describe the beautiful relationships between data. Graphs can. This tool encodes the references in an explicit graph, and to show the user some of the more important nearby connections of the graph as they move along it. Also allows for short, medium, and long form descriptions of subject, so you can dive down in as much detail as you would like.
This is a python project. However, to support its advanced markdown features, it also depends on node and ruby packages.
binary dependencies:
sudo apt install graphviz, ruby, node, npm
ruby packages:
sudo gem install rouge kramdown-math-katex
node packages:
sudo npm install -g katex
Install python package
pip install git+https://github.com/benblack769/graph-notes/
To generate the example website you can run
generate-graph-notes examples/computer_science/ test_out
To view the generated website you can run:
python -m http.server
And once the server is up, you can go to http://localhost:8000/test_out/#binary_search to view the result.
The result should look like this (link to deployed example here):
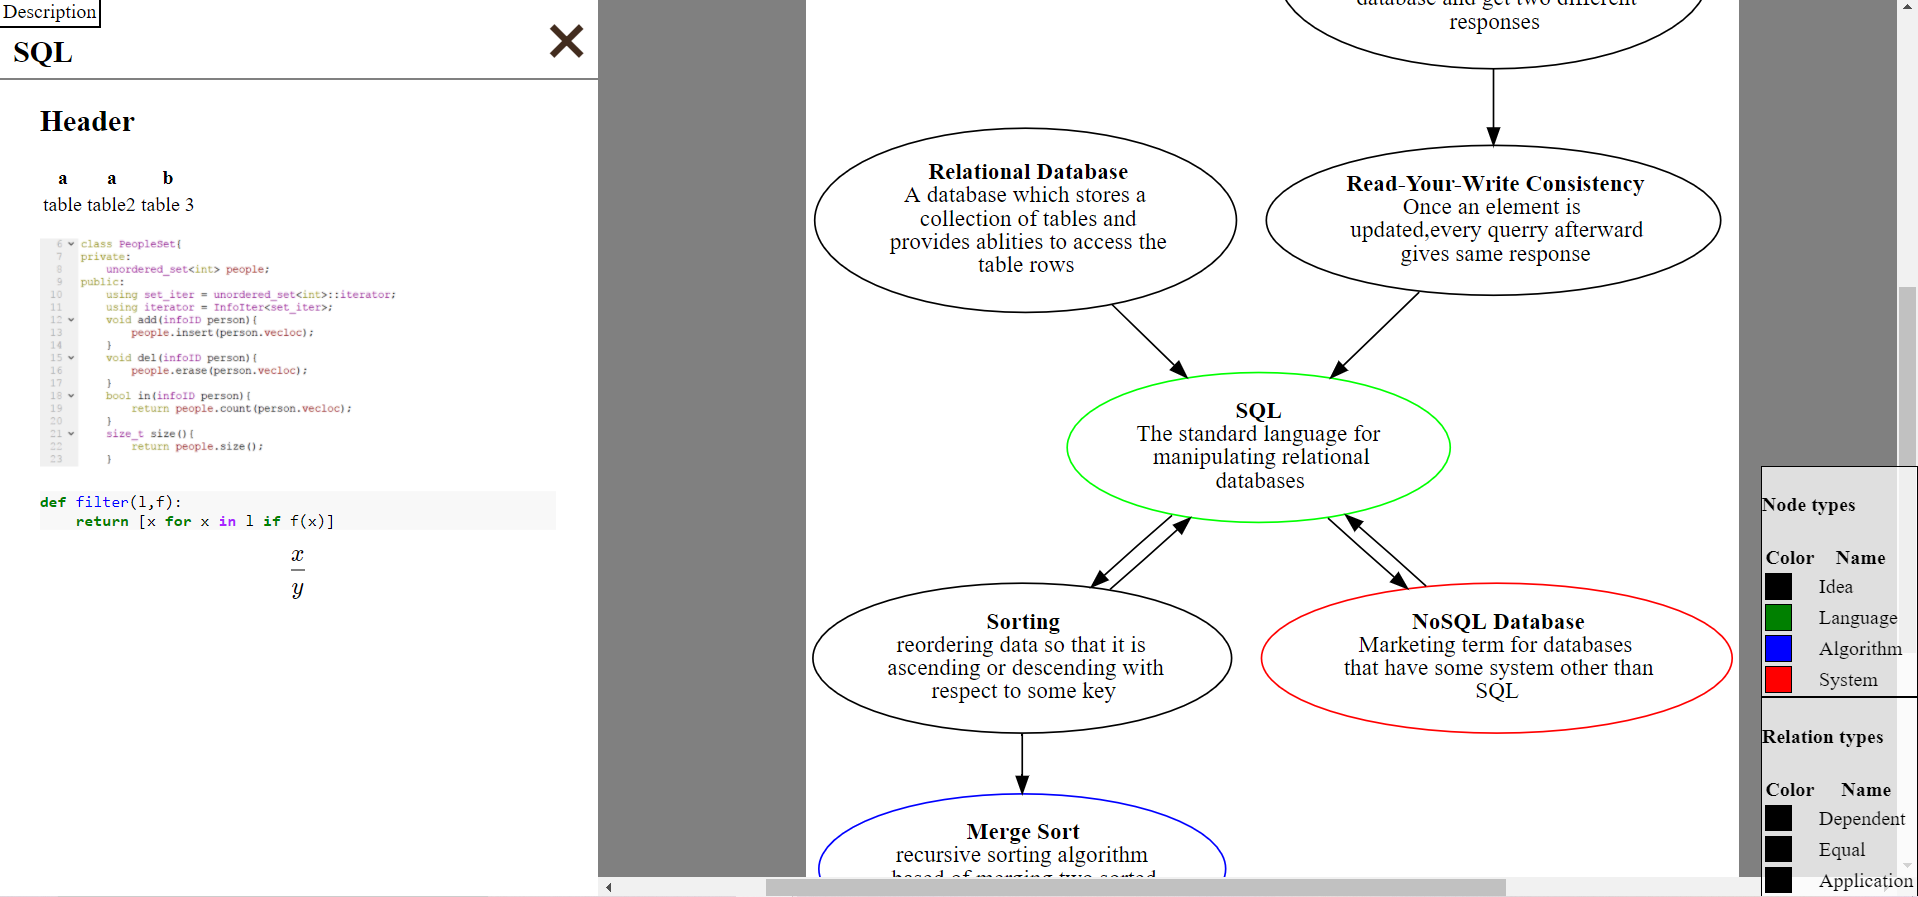
As you can see, the graph and key appear in the center of the screen, and any long form description appears on the left.