Python wrapper for calling functions supplied in the TISEAN package
1
for nonlinear time series analysis (http://www.mpipks-dresden.mpg.de/~tisean/).
[1]: R. Hegger, H. Kantz, and T. Schreiber, Practical implementation of nonlinear time series methods: The TISEAN package, CHAOS 9, 413 (1999). Preprint available: html, other.
TISEANmust be installed and in your path - the code is not included here- This software has so far only been tested on OS X but should be easy to port to Linux/Windows. Suggestions are welcome!
To use this package first import pytisean, numpy and matplotlib:
from pytisean import tiseano, tiseanio
import matplotlib.pyplot as plt
import numpy as np
pytisean supplies two functions:
tiseanofor TISEAN functions that do not need an input file,tiseaniofor functions that do need an input file.
Both return a result and the message that TISEAN prints to stdout or
stderr.
For single output Tisean commands, stdout is an array. In case of Tisean
commands generating multiple output, the stdout will be a dictionary with
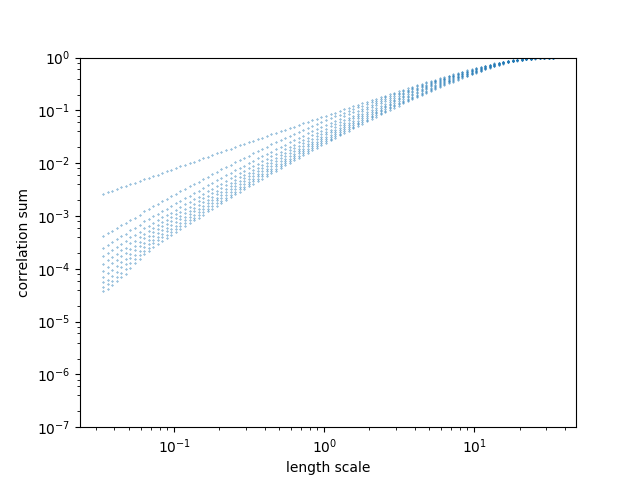
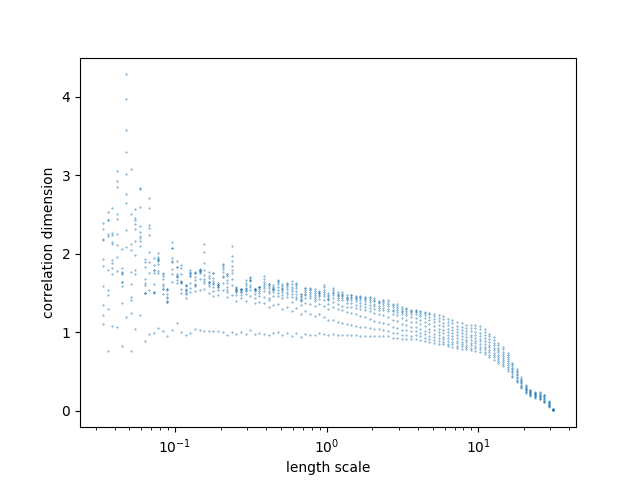
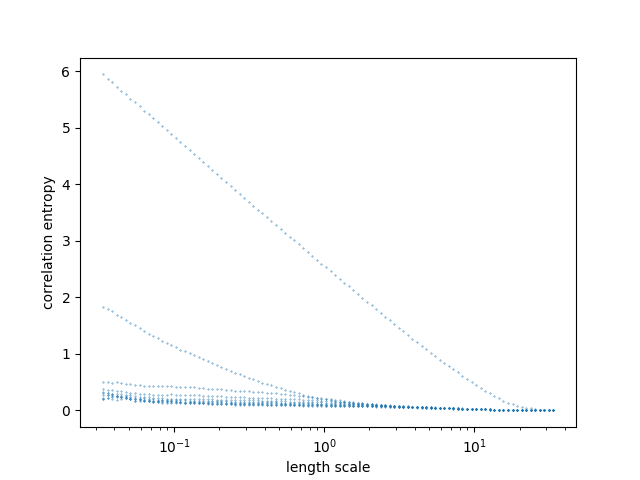
content grouped by their extensions as keywords, e.g. stdout from d2 is a
dictionary with 3 keys, {"c2","d2","h2"}, standing for autocorrelation,
correlation dimension, and entropy respectively.
NOTE Currently for multiple output tisean command, PyTisean only expects
d2. If you have other multiple output commands need to be used with PyTisean,
please inform us.
Examples:
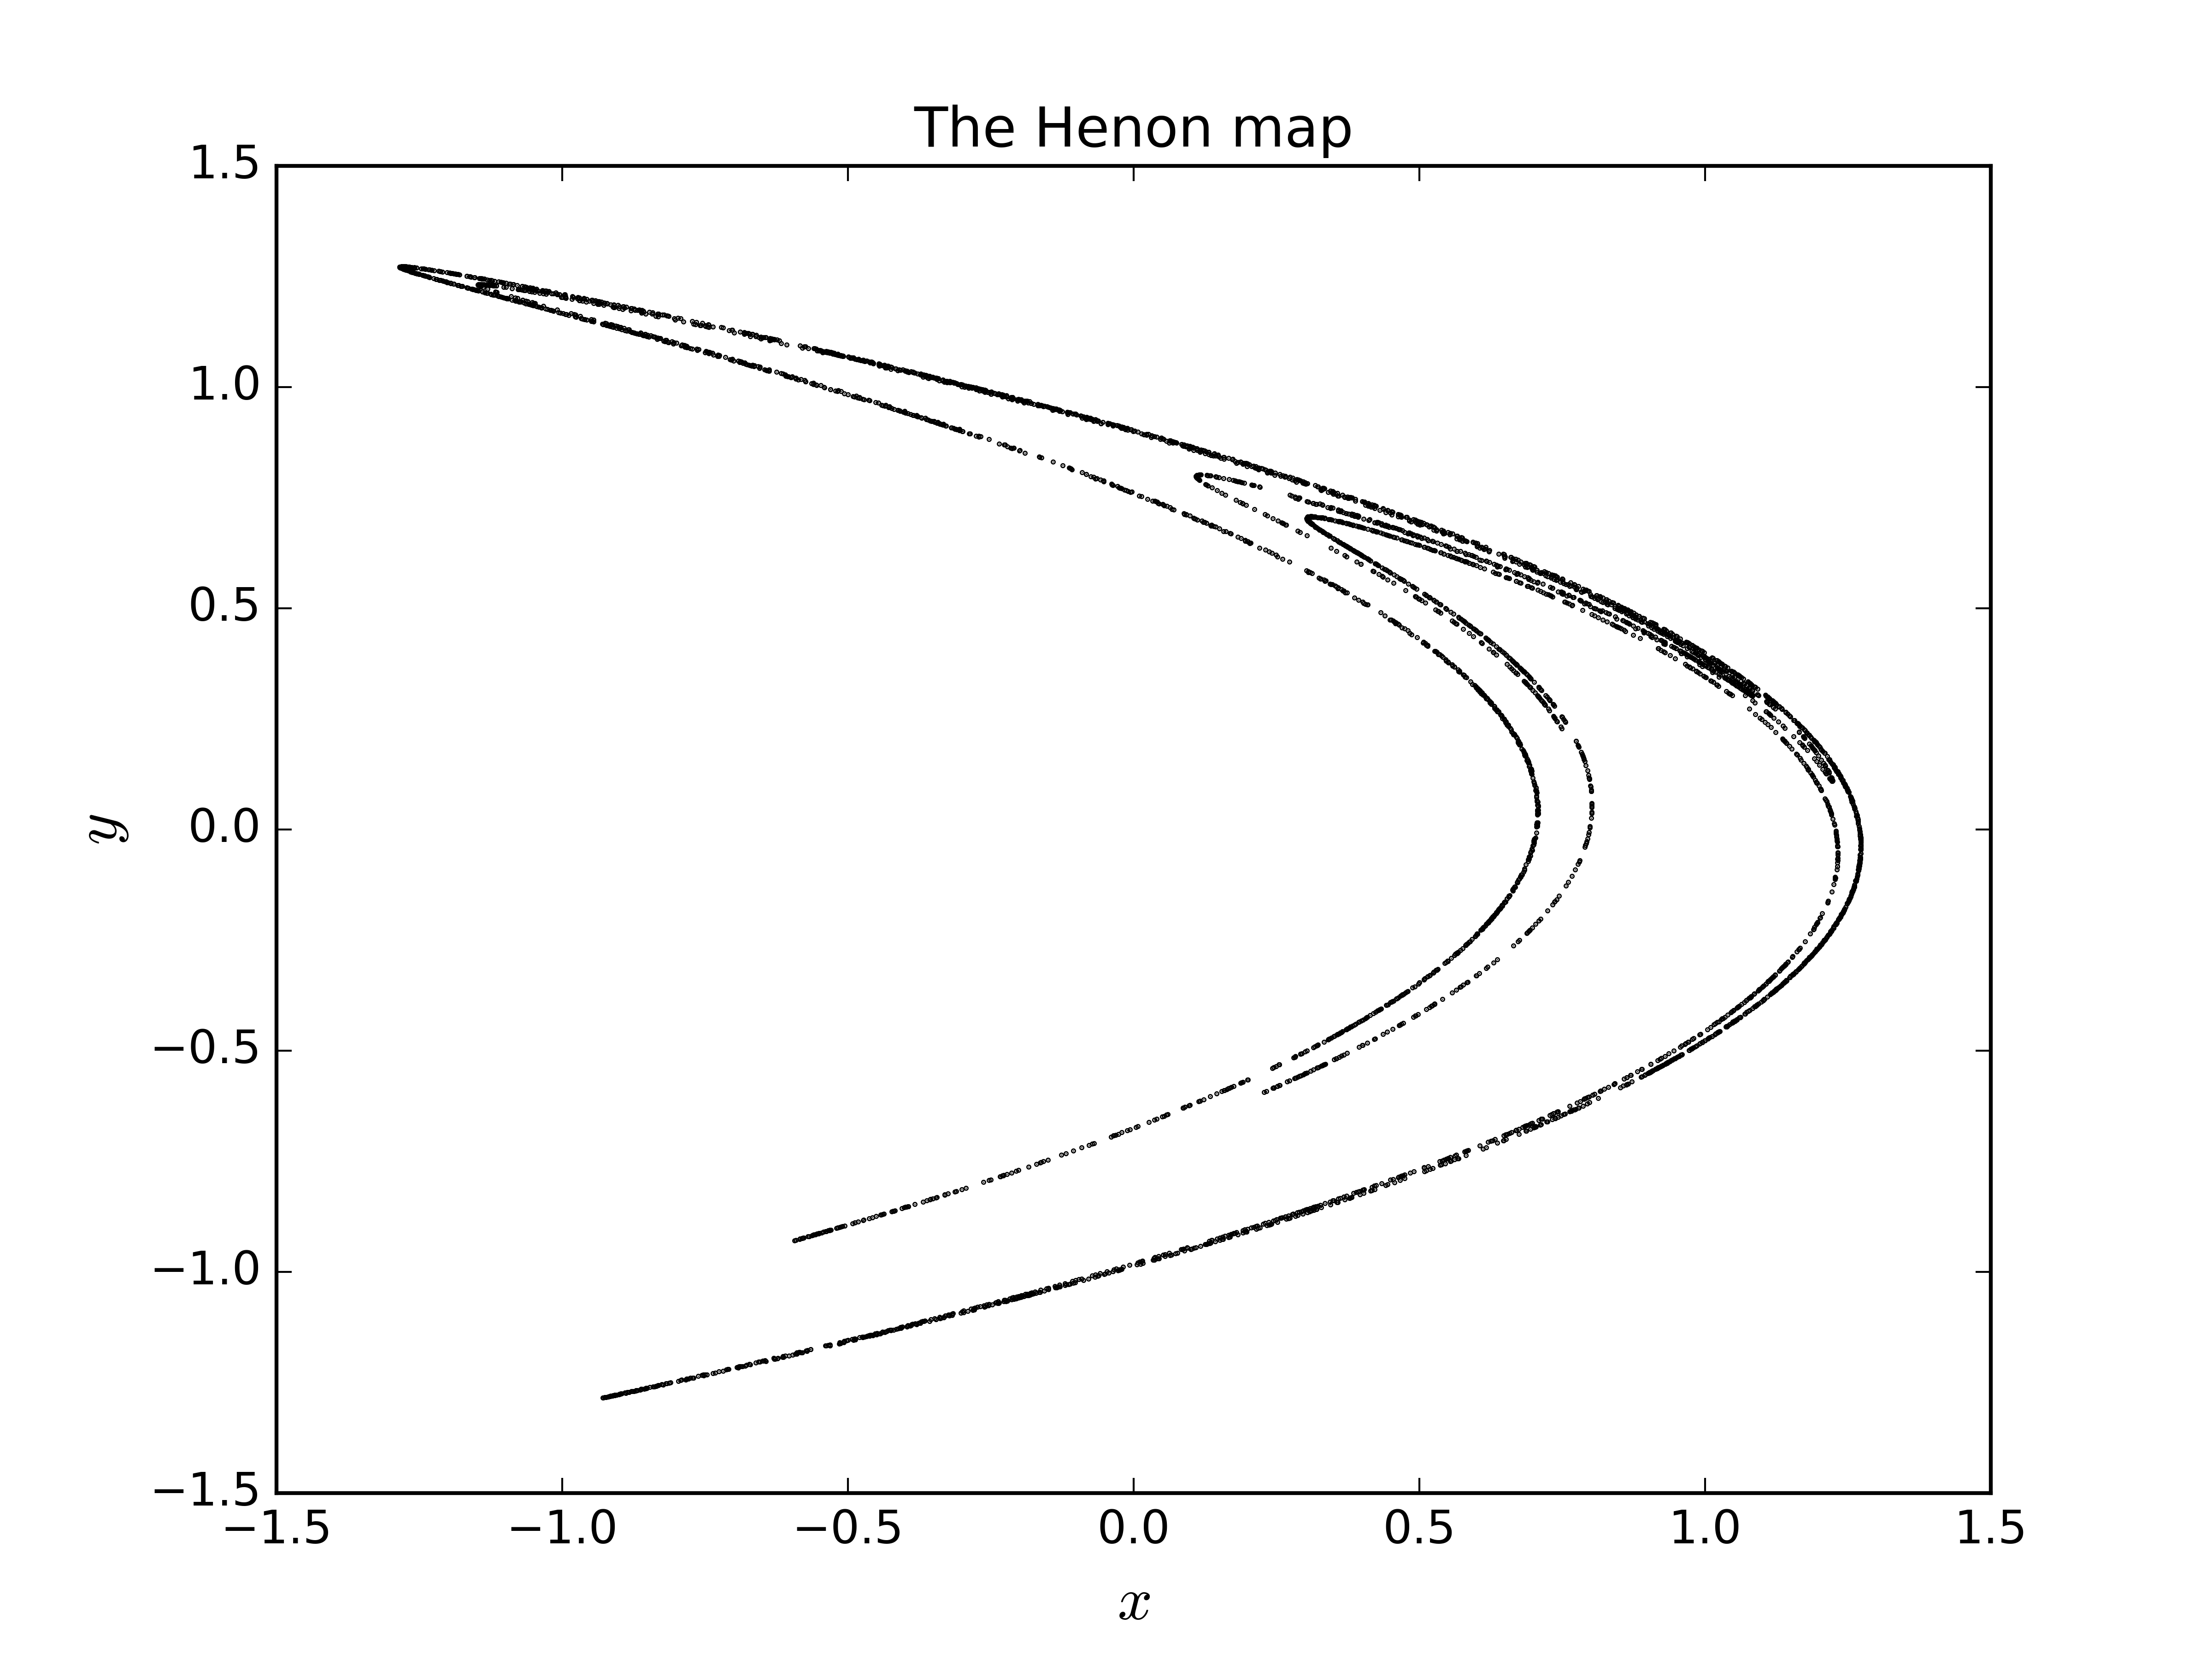
# Generate 5000 iterates of the henon map
henon, msg = tiseano('henon', '-l5000')

# Plot and prettyfi
fig1, ax1 = plt.subplots(1, 1)
ax1.scatter(henon[:, 0], henon[:, 1], color='k', s=0.1)
ax1.set_title('The Henon map')
ax1.set_xlabel(r'$x$', fontsize=16)
ax1.set_ylabel(r'$y$', fontsize=16)
plt.show()
# Generate some data
N = 1000
t = np.linspace(0, N/10*np.pi, N)
x = np.sin(t) + 0.2*np.random.randn(N)
# ... and compute the autocorrelation
acf, msg = tiseanio('corr', '-D', 50, data=x)
# Plot and prettyfi
bluish = '#2976bb' # https://xkcd.com/color/rgb/
fig2, ax2 = plt.subplots(2, 1)
ax2[0].set_title(r'Data and autodorrelation')
ax2[0].plot(t, x, color=bluish)
ax2[0].set_xlim(t[0], t[-1])
ax2[0].set_xlabel(r'$t$', fontsize=16)
ax2[0].set_ylabel(r'$x$', fontsize=16)
ax2[1].plot(acf[:, 0], acf[:, 1], color=bluish)
ax2[1].set_xlabel(r'Lag $k$', fontsize=16)
ax2[1].set_ylabel(r'ACF $\rho_x(k)$', fontsize=16)
plt.show()# generate Lorenz
stdout, msg = tiseano("lorenz", "-l", "2000")
# Multiple output command example (d2)
d2_out, msg = tiseanio("d2", '-N', '0','-c', "1", data=stdout)
# plot output c2
plt.scatter(d2_out["c2"][:,0], d2_out["c2"][:,1],s=0.1)
plt.yscale('log')
plt.ylim([1e-7,1])
plt.xscale('log')
plt.xlabel("length scale")
plt.ylabel("correlation sum")
plt.show()
# plot output d2
plt.scatter(d2_out["d2"][:,0], d2_out["d2"][:,1],s=0.1)
#plt.yscale('log')
plt.xscale('log')
plt.xlabel("length scale")
plt.ylabel("correlation dimension")
plt.show()
# plot output h2
plt.scatter(d2_out["h2"][:,0], d2_out["h2"][:,1],s=0.1)
#plt.yscale('log')
plt.xscale('log')
plt.xlabel("length scale")
plt.ylabel("correlation entropy")
plt.show()- Make sure output parser support all tisean commands
- Add support for Windows


