| output |
|---|
html_document |
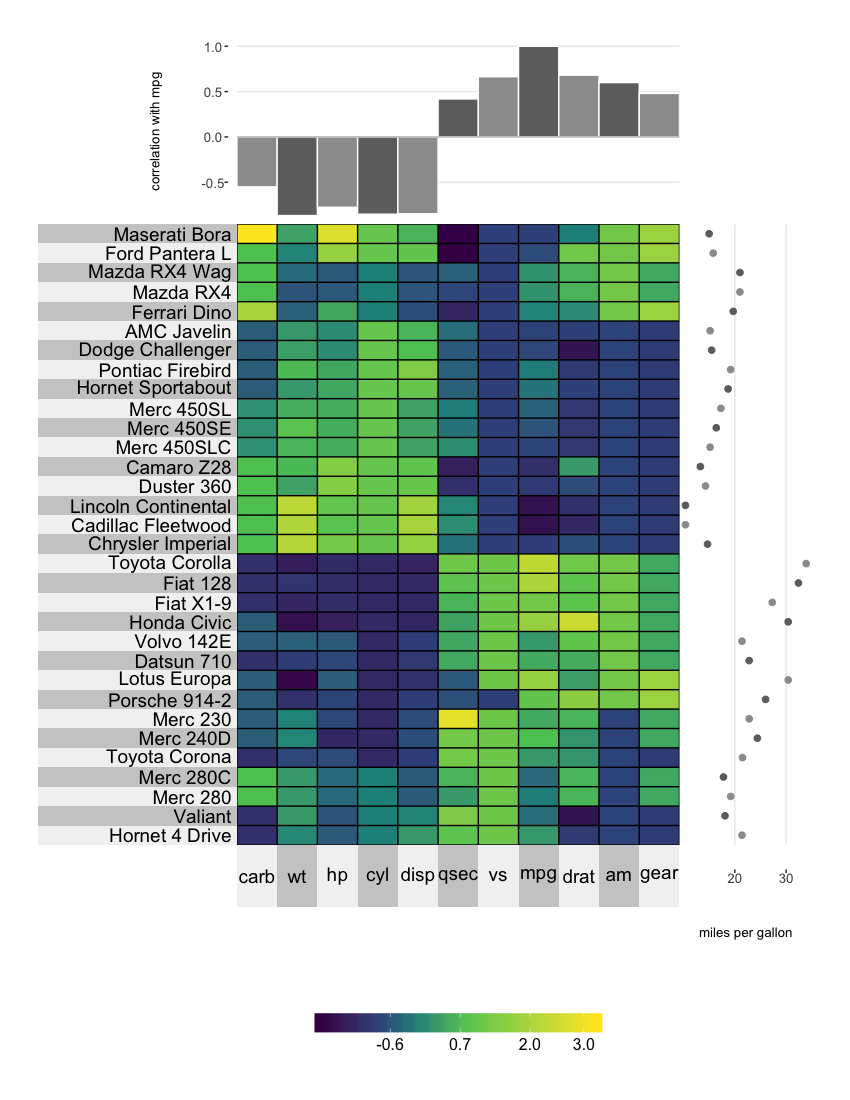
Superheat is an R package for generating beautiful and customizable heatmaps. See the vignette for usage.
If you find any bugs, have any feature requests or feedback, please submit an issue.
To download and install the development version of the package, use devtools:
install.packages("devtools")
devtools::install_github("rlbarter/superheat")
Once you've installed the package, you can load the library in the standard way:
library(superheat)
Basic usage:
superheat(mtcars,
          # normalize variables
          scale = T,
          # order rows/cols based on heirarchical clustering
          pretty.order.rows = TRUE,
          pretty.order.cols = TRUE,
          # plot miles per gallon next to the rows
          yr = mtcars$mpg,
          yr.axis.name = "miles per gallon",
          # plot correlation with mpg above columns
          yt = cor(mtcars)[, "mpg"],
          yt.plot.type = "bar",
          yt.axis.name = "correlation with mpg",
          # increase size of left labels
          left.label.size = 0.45)
