This is the official implementation of the paper Enhancing Scene Graph Generation with Hierarchical Relationships and Commonsense Knowledge in PyTorch.
The work is developed from the preliminary work Hierarchical Relationships: A New Perspective to Enhance Scene Graph Generation accepted at NeurIPS 2023 New Frontiers in Graph Learning Workshop (GLFrontiers) and NeurIPS 2023 Queer in AI, which shares the same GitHub repository.
This work considers the scene graph generation problem. Different from object detection or segmentation, it represents each image as a graph, where each object instance is a node and each relation between a pair of nodes is a directed edge. Our highlights are:
- We leverage the commonsense knowledge from small-scale, open-source, and on-device LLMs/VLMs, filtering out commonsense-violated predictions made by baseline scene graph generation models.
- Hierarchical relationships work surprisingly well: Replacing the flat relation classification head with a Bayesian head, which jointly predicts relationship super-category probabilities and detailed relationships within each super-category, can improve model performance by a large margin.
- Both of our proposed methods are model-agnostic: They can be easily used as plug-and-play modules into existing SOTA works, continuing pushing their SOTA performance to new levels.
We dub our methods as HIERCOM, an acronym for HIErarchical Relationships and COMmonsense Validation.
-
💜 Plug-and-play to existing SOTA works in Scene-Graph-Benchmark framework:
Visit the scenegraph_benchmark/ directory and follow the README_PLUGANDPLAY for step-by-step instructions on how to integrate our methods (hierarchical relationships & commonsense validation) into your own work. We have experimented with on Neural Motifs, VTransE, VCTree, TDE, NICE, IETrans. We hope our methods can support your work in achieving even better performance 🙌
-
💙 A light-weighted standalone baseline model:
Follow the README_BASEMODEL to install dependencies, load datasets and pretrained weights, and start training and evaluation processes. Codes are organized under the top directory.
This diagram provides an overview of HIERCOM. The core components of HIERCOM are the hierarchical relation head and the commonsense validation pipeline, both of which are model-agnostic plug-and-play modules, suitable for integration with a variety of baseline scene graph generation models that have a conventional flat classification head. Specifically, the hierarchical relation head is designed to replace this flat layer, jointly estimating relation super-categories and more granular relations within each category. Additionally, the diagram depicts a baseline scene graph generation model: an RGB image is the input, supplemented by an estimated depth map. Using the DETR object detector, the model generates feature maps, object labels, and bounding boxes. Relationship estimation between each pair of instances occurs in two separate passes - to account for directional relationships - first assuming one instance as the subject and then the other. Subsequently, the commonsense validation pipeline leverages an LLM or VLM - which can have a small size - to filter out commonsense-violating predicates, thus refining the final scene graphs to include more predicates that align with the common sense.
If you are also working on scene graph generation and find our work interesting, please consider citing our work. Thank you!
@article{jiang2023enhancing,
 title={Enhancing Scene Graph Generation with Hierarchical Relationships and Commonsense Knowledge},
 author={Jiang, Bowen and Zhuang, Zhijun and Taylor, Camillo Jose},
 journal={arXiv preprint arXiv:2311.12889},
 year={2023}
}

@article{jiang2023scene,
 title={Scene graph generation from hierarchical relationship reasoning},
 author={Jiang, Bowen and Taylor, Camillo J},
 journal={arXiv preprint arXiv:2303.06842},
 year={2023}
}
There is a subtle problem on Google Scholar if the authors change their paper title, so the second BibTeX actually refers to the preliminary work Hierarchical Relationships: A New Perspective to Enhance Scene Graph Generation accepted at NeurIPS 2023 Workshop.
- 1. Clean up the codes for integrating hierarchical classification and commonsense validation as portable modules to other existing SOTA works in Scene-Graph-Benchmark
- 2. Add unsupervised relation super-category clustering from pretrained GPT2, BERT, and CLIP token embeddings, eliminating the need for humans to classify relation labels.\
- 3. Release all pretrained model weights. (partially done)
- 4. Clean up the codes for efficient single-image inference.
- 5. Clean up the codes for running experiments on the OpenImage V6 dataset.
- 6. VQA is a commonly explored downstream task in the scene graph generation community, and we expect to release a preliminary manuscript and codes within the next few months, so please stay tuned for updates! [Update] It is now released and available at Multi-Agent VQA. This work has been accepted to CVPR 2024 CVinW Workshop as a Spotlight.
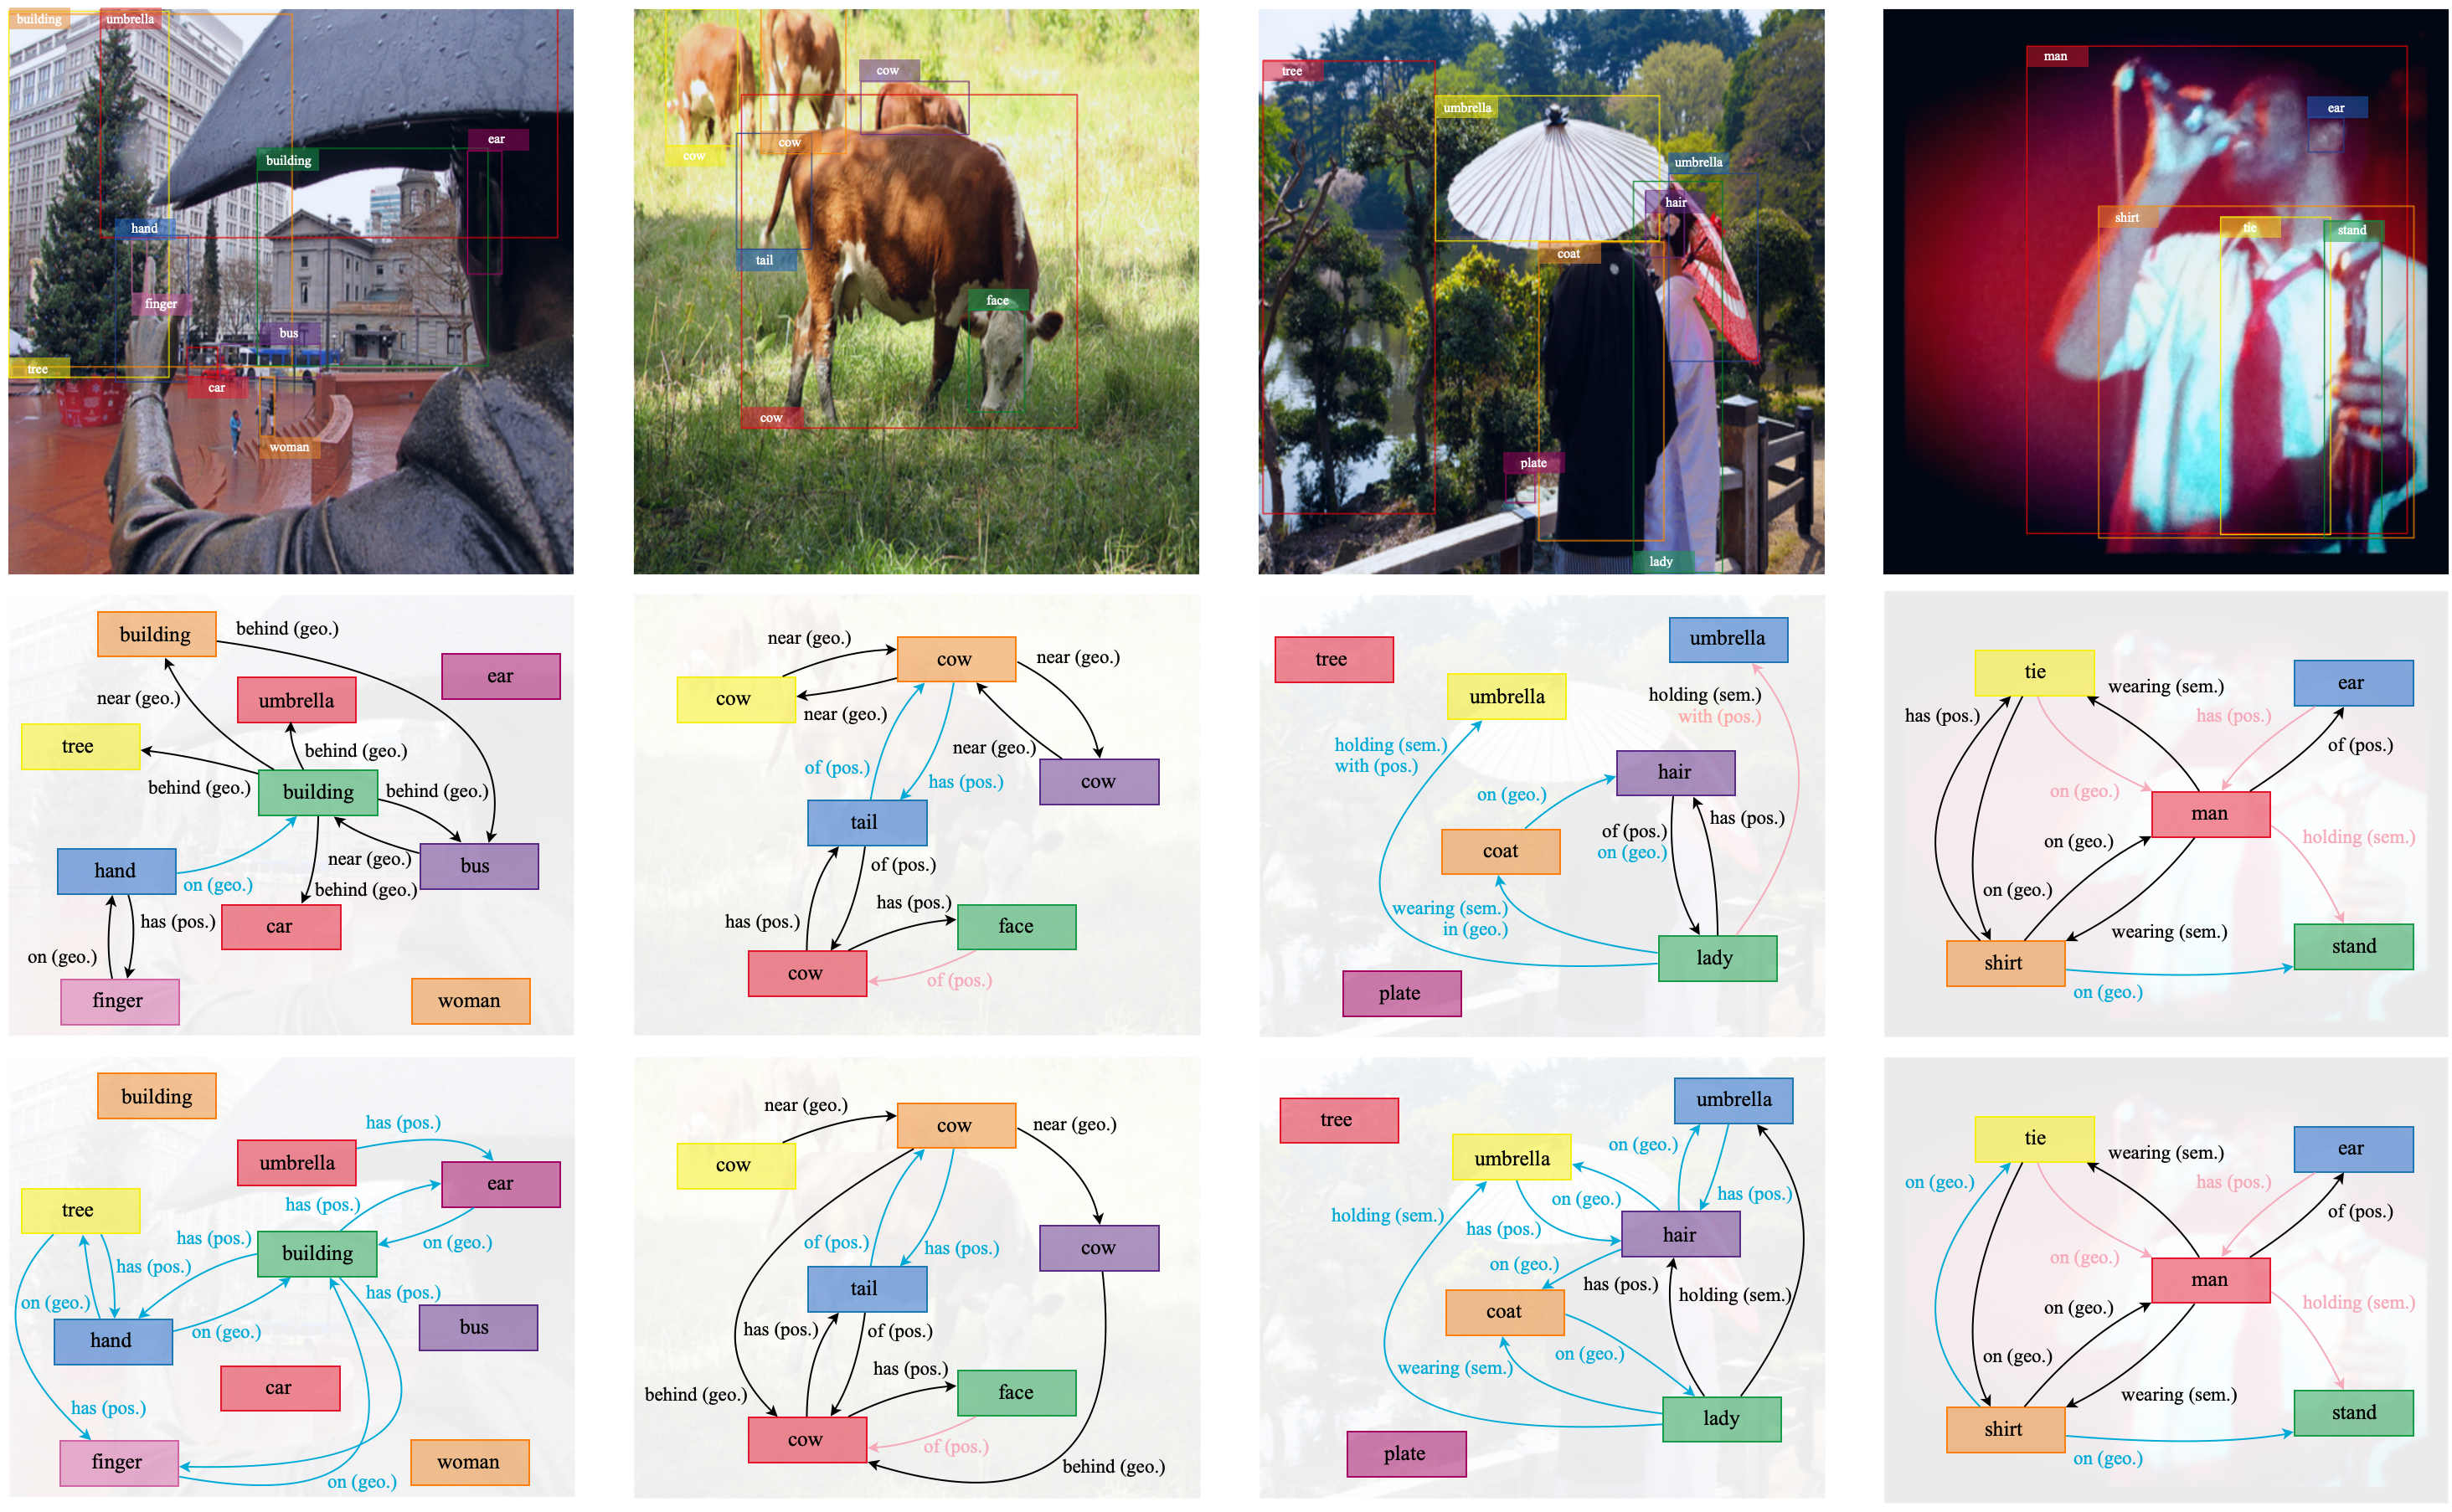
Illustration of generated scene graphs on predicate classification. All examples are from the testing dataset of Visual Genome. The first row displays images and objects, while the second row displays the final scene graphs. The third row shows an ablation without commonsense validation, where there exist many unreasonable predictions with high confidence. For each image, we display the top 10 most confident predictions, and each edge is annotated with its relation label and relation super-category. It is possible for an edge to have multiple predicted relationships, but they must come from disjoint super-categories. Blue edges represent incorrect edges based on our observations. Pink edges are true positives in the dataset. Interestingly, all black edges are reasonable predictions we believe but not annotated, which should not be regarded as false positives.


