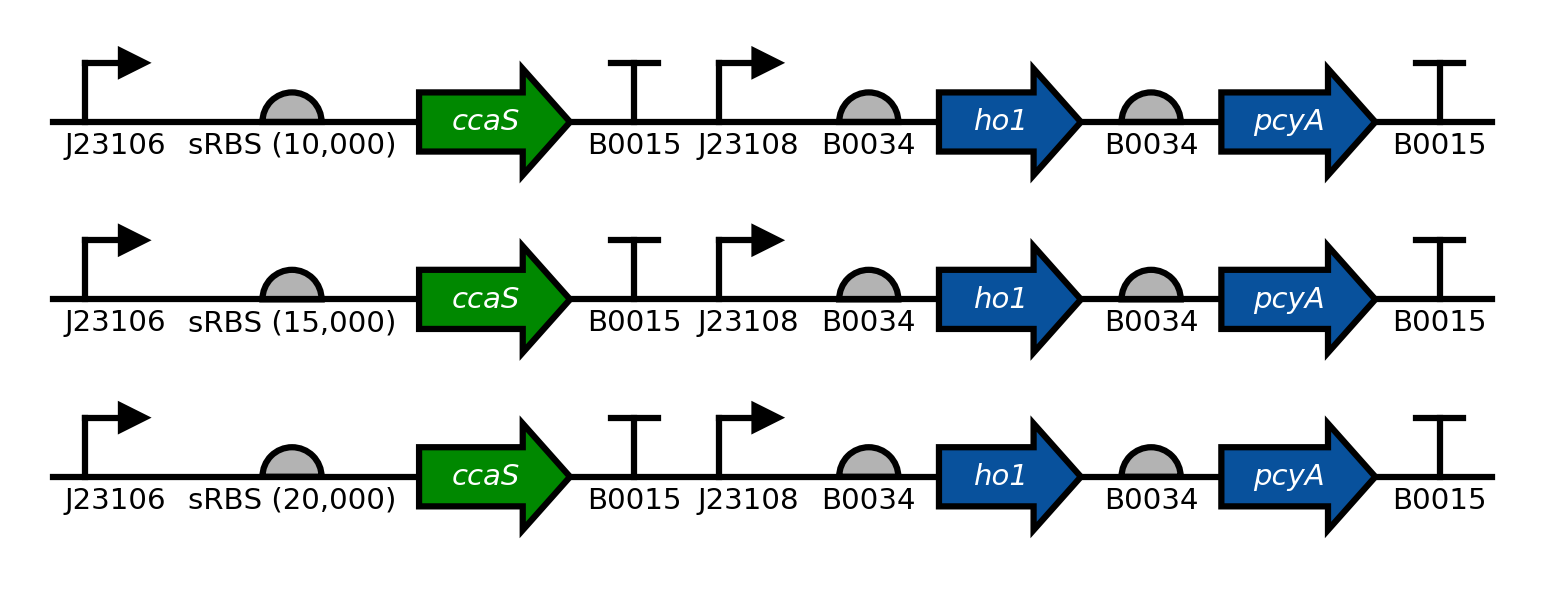
Benchling2SBOLv uses the Benchling API Client to read a DNA sequence from Benchling, and dnaplotlib to instantly plot that sequence as an SBOL Visual diagram.
Make sure to install dnaplotlib and the Benchling API Client first.
Clone or download this repository, and run the following from a terminal:
python setup.py install
First, you will need to request an API key from Benchling. You can do that either via email or using the chat function in the Benchling UI.
The following are examples whose successful execution depend on access to the relevant benchling sequences. Therefore, these will probably not work for you unless you use a sequence name that you can access.
A sequence from benchling can be automatically plotted with little more than a single function call:
import matplotlib
import benchlingclient
import benchling2sbolv

# The following is necessary so that latex-rendered text is not italicized by
# default.
matplotlib.rcParams['mathtext.default'] = 'regular'

# Specify benchling key
benchlingclient.LOGIN_KEY = 'write_your_key_here!'

# Plot one sequence
# Name: pSR58_6, from base 700 to 3000.
# Promoter 'PcpcG2-172' has a special latex-formatted label so that it
# looks prettier.
# Color of CDSs 'ccaR' and 'sfgfp' are changed to different shades of
# green.
# Save figure as "example_one_seq.png"
seq = benchling2sbolv.plot_sequence(
    seq_name='pSR58_6',
    start_position=700,
    end_position=3000,
    glyph_labels={'PcpcG2-172': r'$P_{\mathit{cpcG2}-172}$'},
    cds_colors={'ccaR': '#aaffaa',
                'sfgfp': '#00FF00',
                },
    savefig='example_one_seq.png')
Similarly, many sequences can be plotted stacked on top of one another.
# Import packages
import benchlingclient
import benchling2sbolv

# Specify benchling key
benchlingclient.LOGIN_KEY = 'write_your_key_here!'

# Plot many sequences
# Sequence names are 'pSR43_2', 'pSR43_3', 'pSR43_4'.
# From bases 700 to 5200
# Colors and label colors for CDSs ho1, pcyA, and sfgfp are custom.
# Save as "example_many_seqs.png"
seq = benchling2sbolv.plot_sequences(
    seq_names=['pSR43_2', 'pSR43_3', 'pSR43_4'],
    start_position=700,
    end_position=5200,
    cds_colors={'ho1': '#08519c',
                'pcyA': '#08519c',
                'ccaS': '#008800',
                },
    cds_label_colors={'ho1': '#ffffff',
                       'pcyA': '#ffffff',
                       'ccaS': '#ffffff',
                       },
savefig='example_many_seqs.png')Because Benchling2SBOLv converts Benchling sequence annotations to SBOL glyphs, it has to assume a few things about the sequence to be plotted:
- Genes or CDSs are annotated with the annotation type "CDS".
- Promoters are annotated with the annotation type "Promoter".
- Ribosome binding sites are annotated with the annotation type "RBS".
- Transcriptional terminators are annotated with the annotation type "Terminator".
All of these are case sensitive.
However, these can be customized. For example, if all genes are annotated with the type "Gene", the following could be added to a script right after importing Benchling2SBOLv but before plotting anything:
benchling2sbolv.ANN_PARTS_MAPPING.append(
    {'annotation': {'type': 'Gene'},
     'part': 'CDS'})
This tells Benchling2SBOLv to plot annotations with type "Gene" using a CDS glyph as defined by dnaplotlib.
This package is still in early alpha, and may not support all use cases yet. Suggestions or bug reports are welcome in the "Issues" section of the github repo.

