ShinyCell is a R package that allows users to create interactive Shiny-based
web applications to visualise single-cell data via (i) visualising cell
information and/or gene expression on reduced dimensions e.g. UMAP, (ii)
visualising the coexpression of two genes on reduced dimensions, (iii)
visualising the distribution of continuous cell information e.g. nUMI / module
scores using violin plots / box plots, (iv) visualising the composition of
different clusters / groups of cells using proportion plots and (v)
visualising the expression of multiple genes using bubbleplots / heatmap.
Examples of ShinyCell-generated shiny apps for single and multi datasets can
be found at http://shinycell1.ddnetbio.com and http://shinycell2.ddnetbio.com
respectively.
If you are using ShinyCell, please cite Ouyang et al. ShinyCell: Simple and
sharable visualisation of single-cell gene expression data. Bioinformatics,
doi:10.1093/bioinformatics/btab209. The manuscript
is recently accepted and we will update the full citation when it is available.
Key features of ShinyCell include:
-
Written in R and uses the Shiny package, allowing for easy sharing on online platforms e.g. shinyapps.io and Amazon Web Services (AWS) or be hosted via Shiny Server
-
Supports all of the major single-cell data formats (h5ad / loom / Seurat / SingleCellExperiment) and we also include a simple tutorial to process plain-text gene expression matrices
-
Web interface have low memory footprint due to the use of hdf5 file system to store the gene expression. Only the expression of genes that are plotted are loaded into memory
-
Inclusion of less common single-cell visualisations, namely coexpression plots and proportion plots that provide additional information on top of low-dimensional embeddings
-
Users can export visualisations as PDF or PNG images for presentation or publication use
-
Ability to include multiple single-cell datasets into a single Shiny web app
-
It is easy to use and customise aethetsics e.g. label names and colour palettes. In the simplest form, ShinyCell can convert an input single-cell data into a Shiny app with five lines of code (see Quick Start Guide)
We also compared ShinyCell with nine other popular scRNA-seq visualisation
tools, which further highlights the key features of ShinyCell. For a more
detailed description, see the
Supplementary Information.
This readme is broken down into the following sections:
-
Installation on how to install
ShinyCell -
Quick Start Guide to rapidly deploy a shiny app with a few lines of code
There are also additional tutorials as follows:
-
Tutorial for creating a ShinyCell app containing several single-cell datasets
-
Tutorial on other supported file formats (h5ad / loom / SCE)
First, users can run the following code to check if the packages required by
ShinyCell exist and install them if required:
reqPkg = c("data.table", "Matrix", "hdf5r", "reticulate", "ggplot2",
           "gridExtra", "glue", "readr", "RColorBrewer", "R.utils", "Seurat")
newPkg = reqPkg[!(reqPkg %in% installed.packages()[,"Package"])]
if(length(newPkg)){install.packages(newPkg)}

# If you are using h5ad file as input, run the code below as well
# reticulate::py_install("anndata")
Furthermore, on the system where the Shiny app will be deployed, users can run the following code to check if the packages required by the Shiny app exist and install them if required:
reqPkg = c("shiny", "shinyhelper", "data.table", "Matrix", "DT", "hdf5r",
           "reticulate", "ggplot2", "gridExtra", "magrittr", "ggdendro")
newPkg = reqPkg[!(reqPkg %in% installed.packages()[,"Package"])]
if(length(newPkg)){install.packages(newPkg)}
ShinyCell can then be installed from GitHub as follows:
devtools::install_github("SGDDNB/ShinyCell")In short, the ShinyCell package takes in an input single-cell object and
generates a ShinyCell config scConf containing labelling and colour palette
information for the single-cell metadata. The ShinyCell config and single-cell
object are then used to generate the files and code required for the shiny app.
In this example, we will use single-cell data (Seurat object) containing intermediates collected during the reprogramming of human fibroblast into induced pluripotent stem cells using the RSeT media condition, taken from Liu, Ouyang, Rossello et al. Nature (2020). The Seurat object can be downloaded here.
A shiny app can then be quickly generated using the following code:
library(Seurat)
library(ShinyCell)

getExampleData()                       # Download example dataset (~200 MB)
seu = readRDS("readySeu_rset.rds")
scConf = createConfig(seu)
makeShinyApp(seu, scConf, gene.mapping = TRUE,
             shiny.title = "ShinyCell Quick Start")
The generated shiny app can then be found in the shinyApp/ folder (which is
the default output folder). To run the app locally, use RStudio to open either
server.R or ui.R in the shiny app folder and click on "Run App" in the top
right corner. The shiny app can also be deployed online via online platforms
e.g. shinyapps.io and Amazon Web Services (AWS)
or be hosted via Shiny Server. For further details, refer to
Instructions on how to deploy ShinyCell apps online.
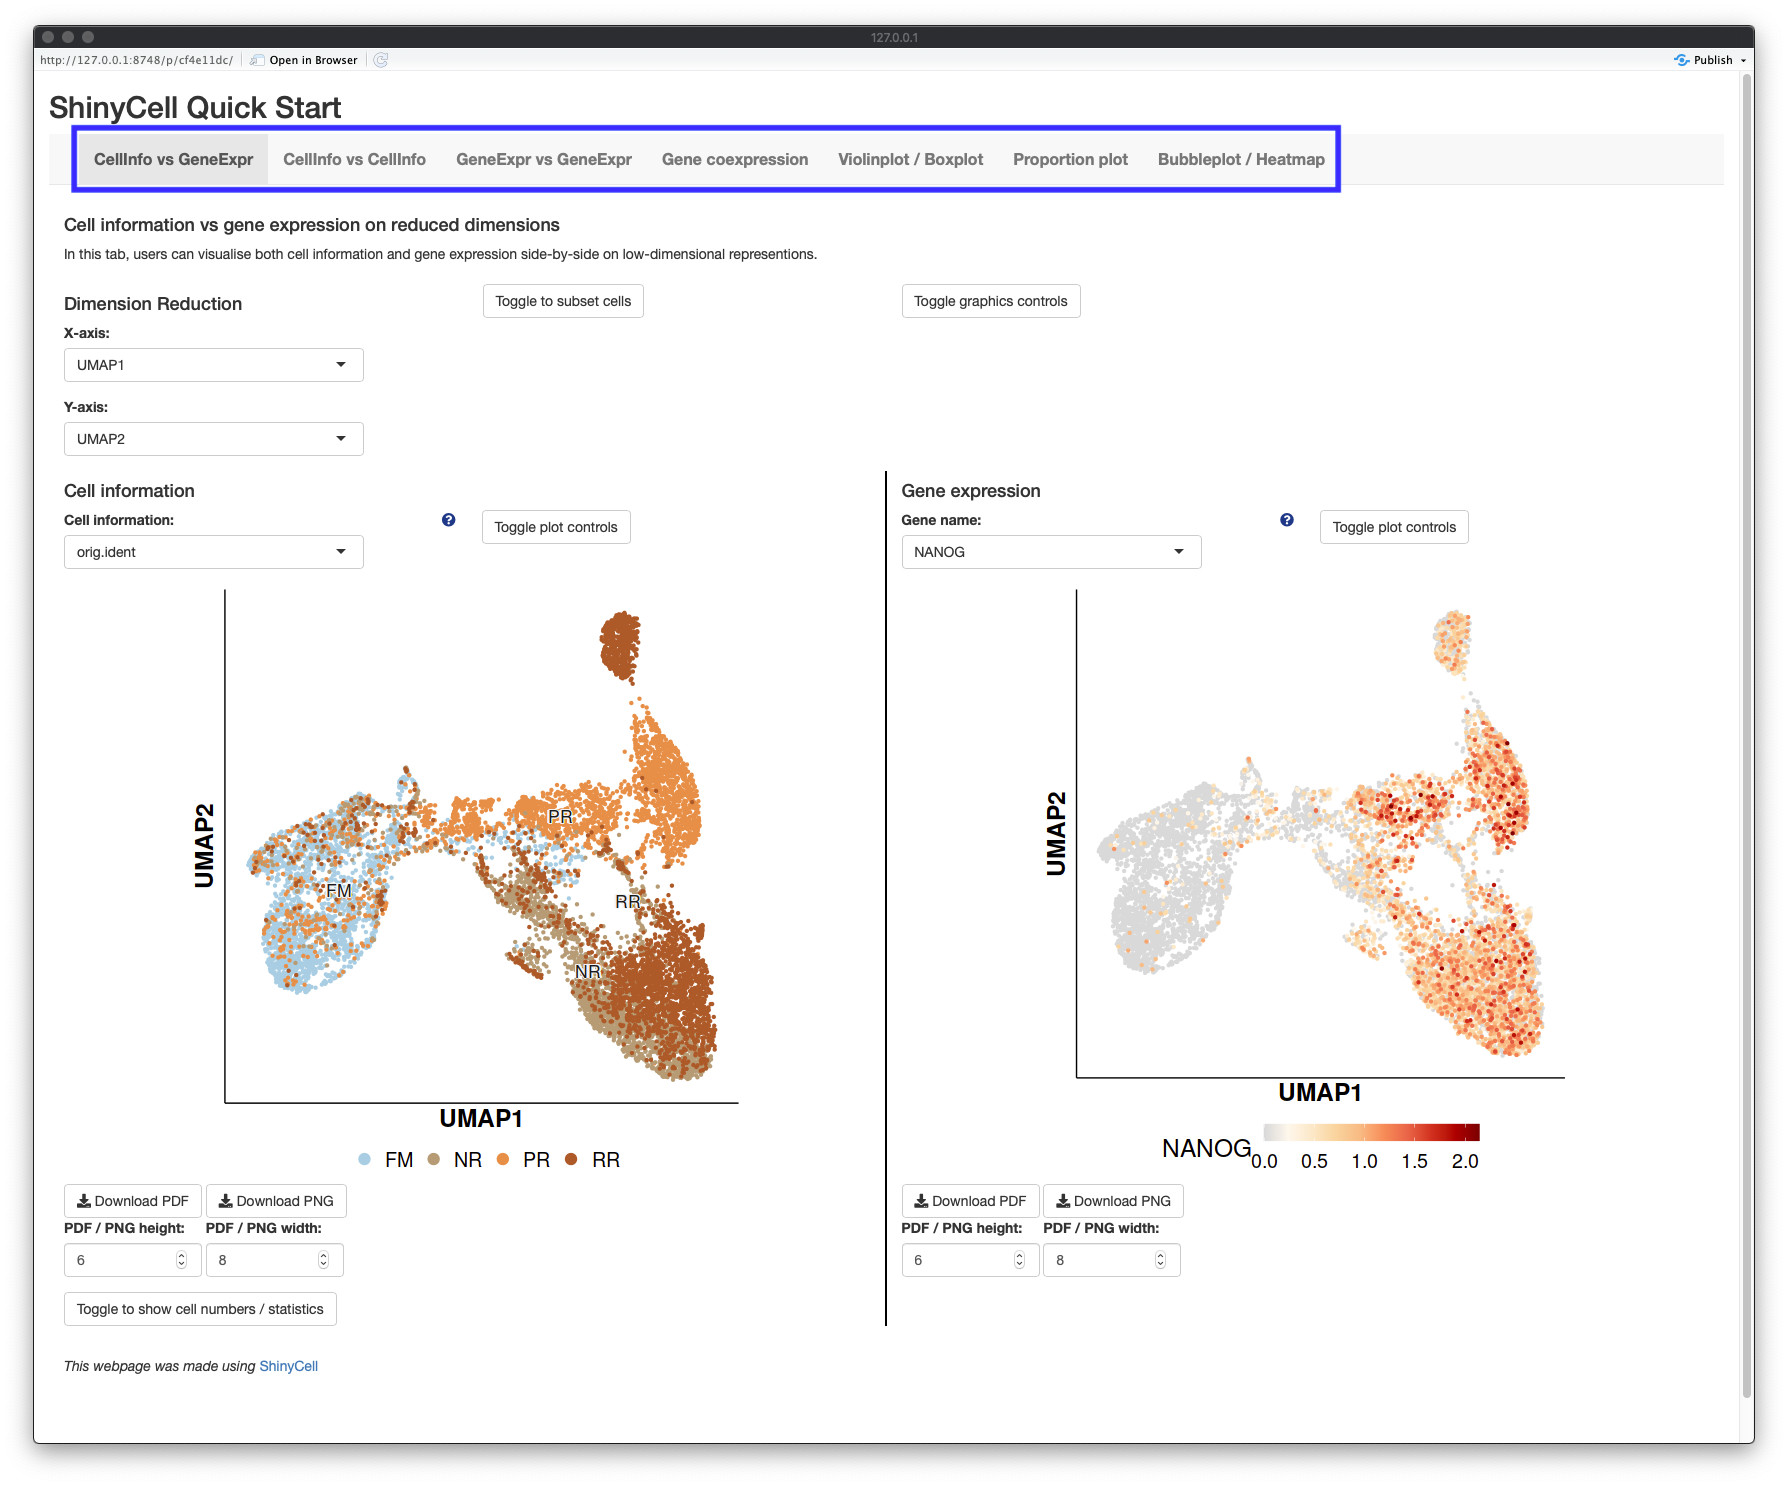
The shiny app contains seven tabs (highlighted in blue box), with the opening page showing the first tab "CellInfo vs GeneExpr" (see below), plotting both cell information and gene expression side-by-side on reduced dimensions e.g. UMAP. Users can click on the toggle on the bottom left corner to display the cell numbers in each cluster / group and the number of cells expressing a gene. The next two tabs are similar, showing either two cell information side-by-side (second tab: "CellInfo vs CellInfo") or two gene expressions side-by-side (third tab: "GeneExpr vs GeneExpr").
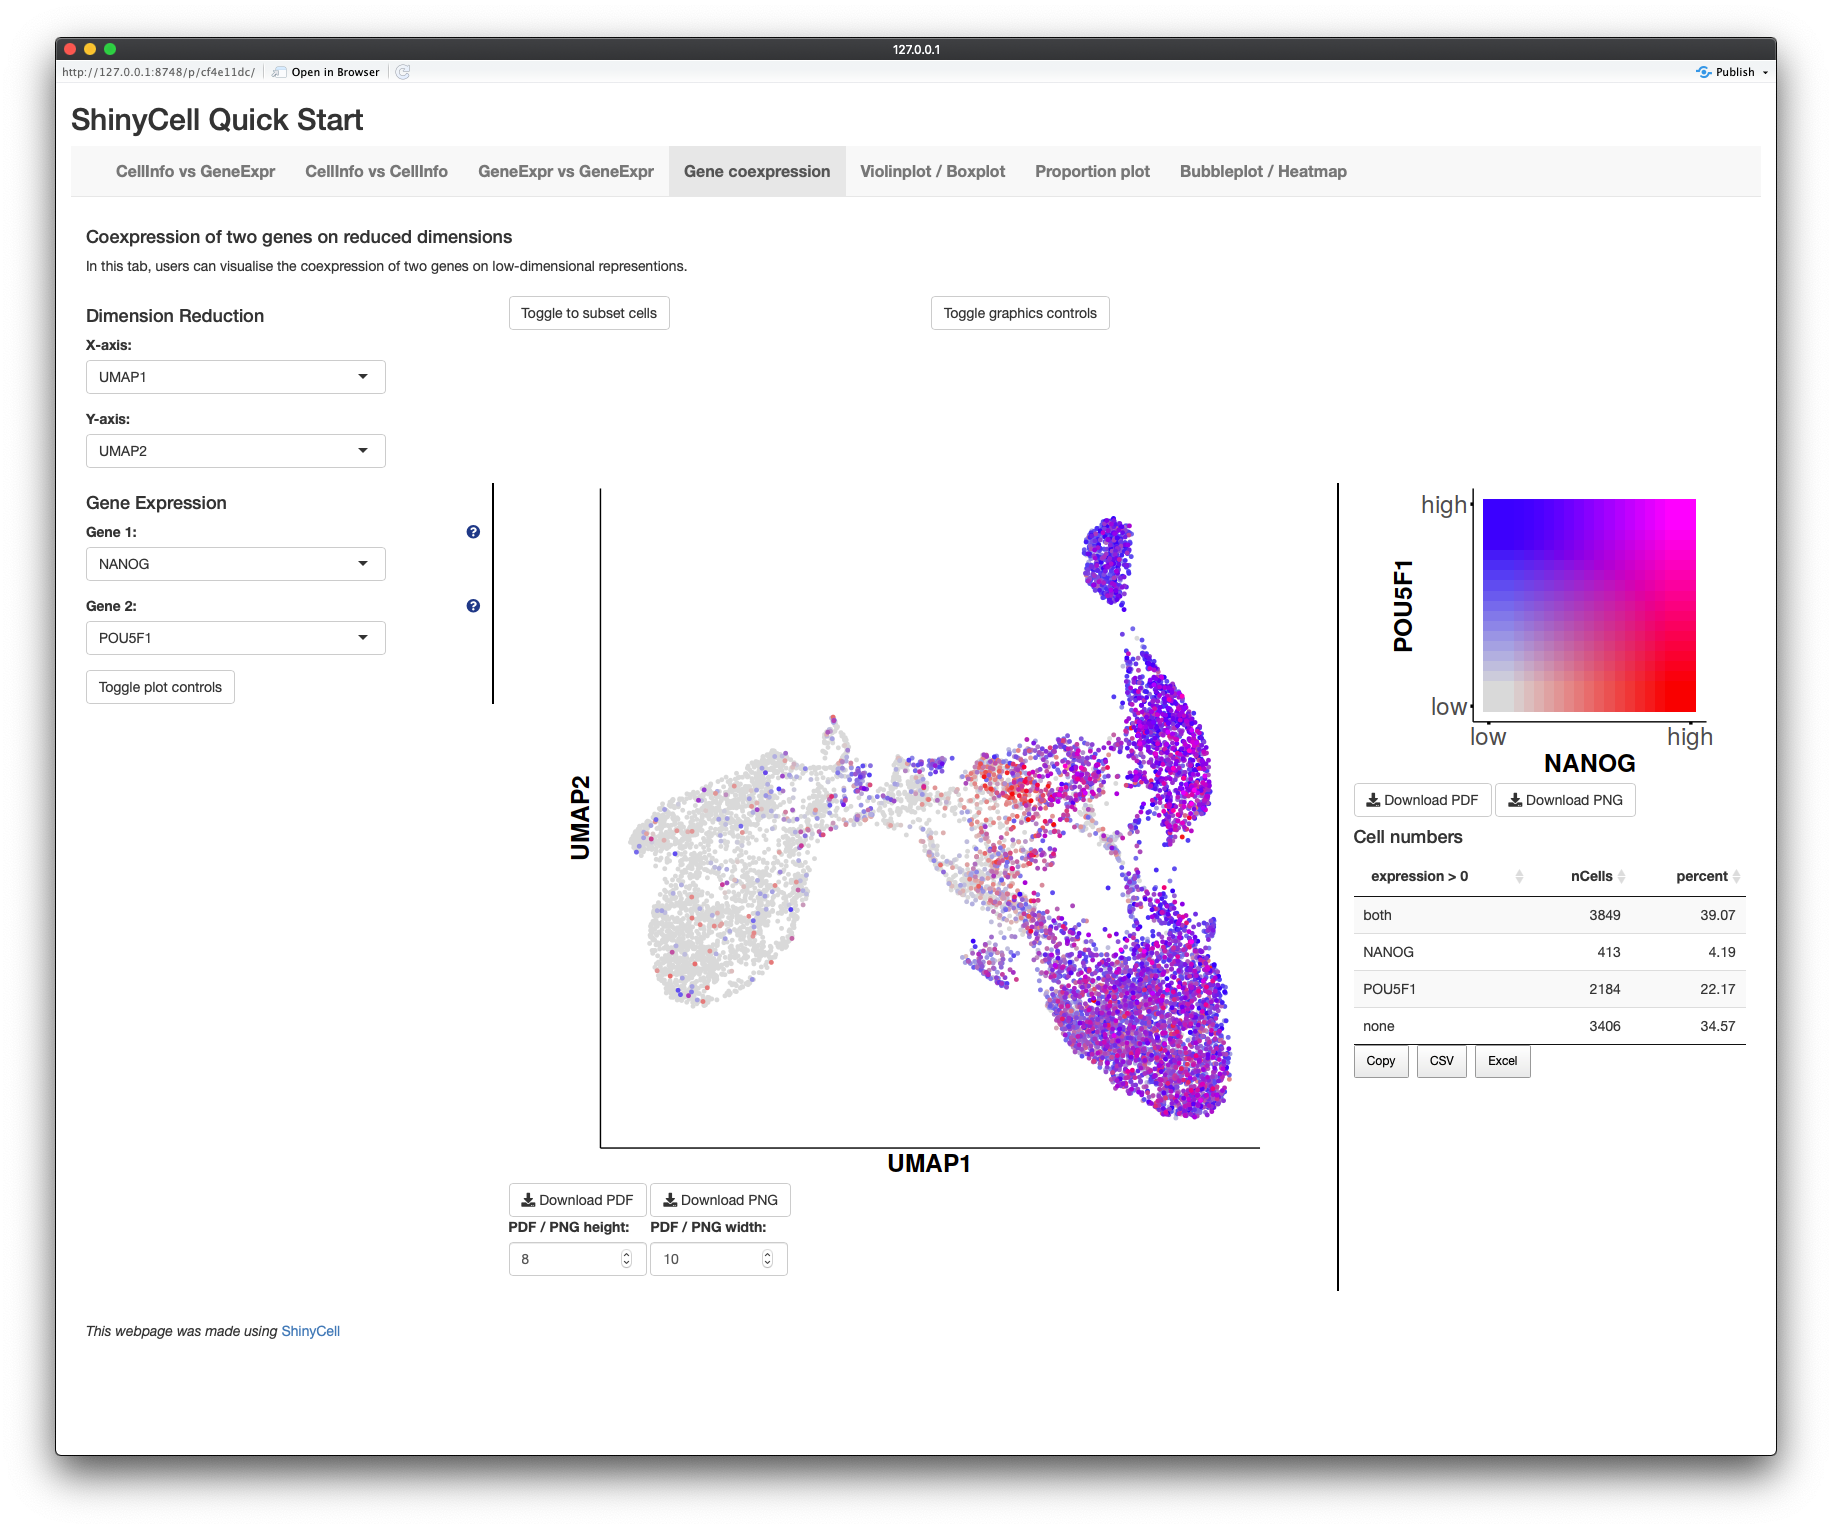
The fourth tab "Gene coexpression" blends the gene expression of two genes, given by two different colour hues, onto the same reduced dimensions plot. Furthermore, the number of cells expressing either or both genes are given.
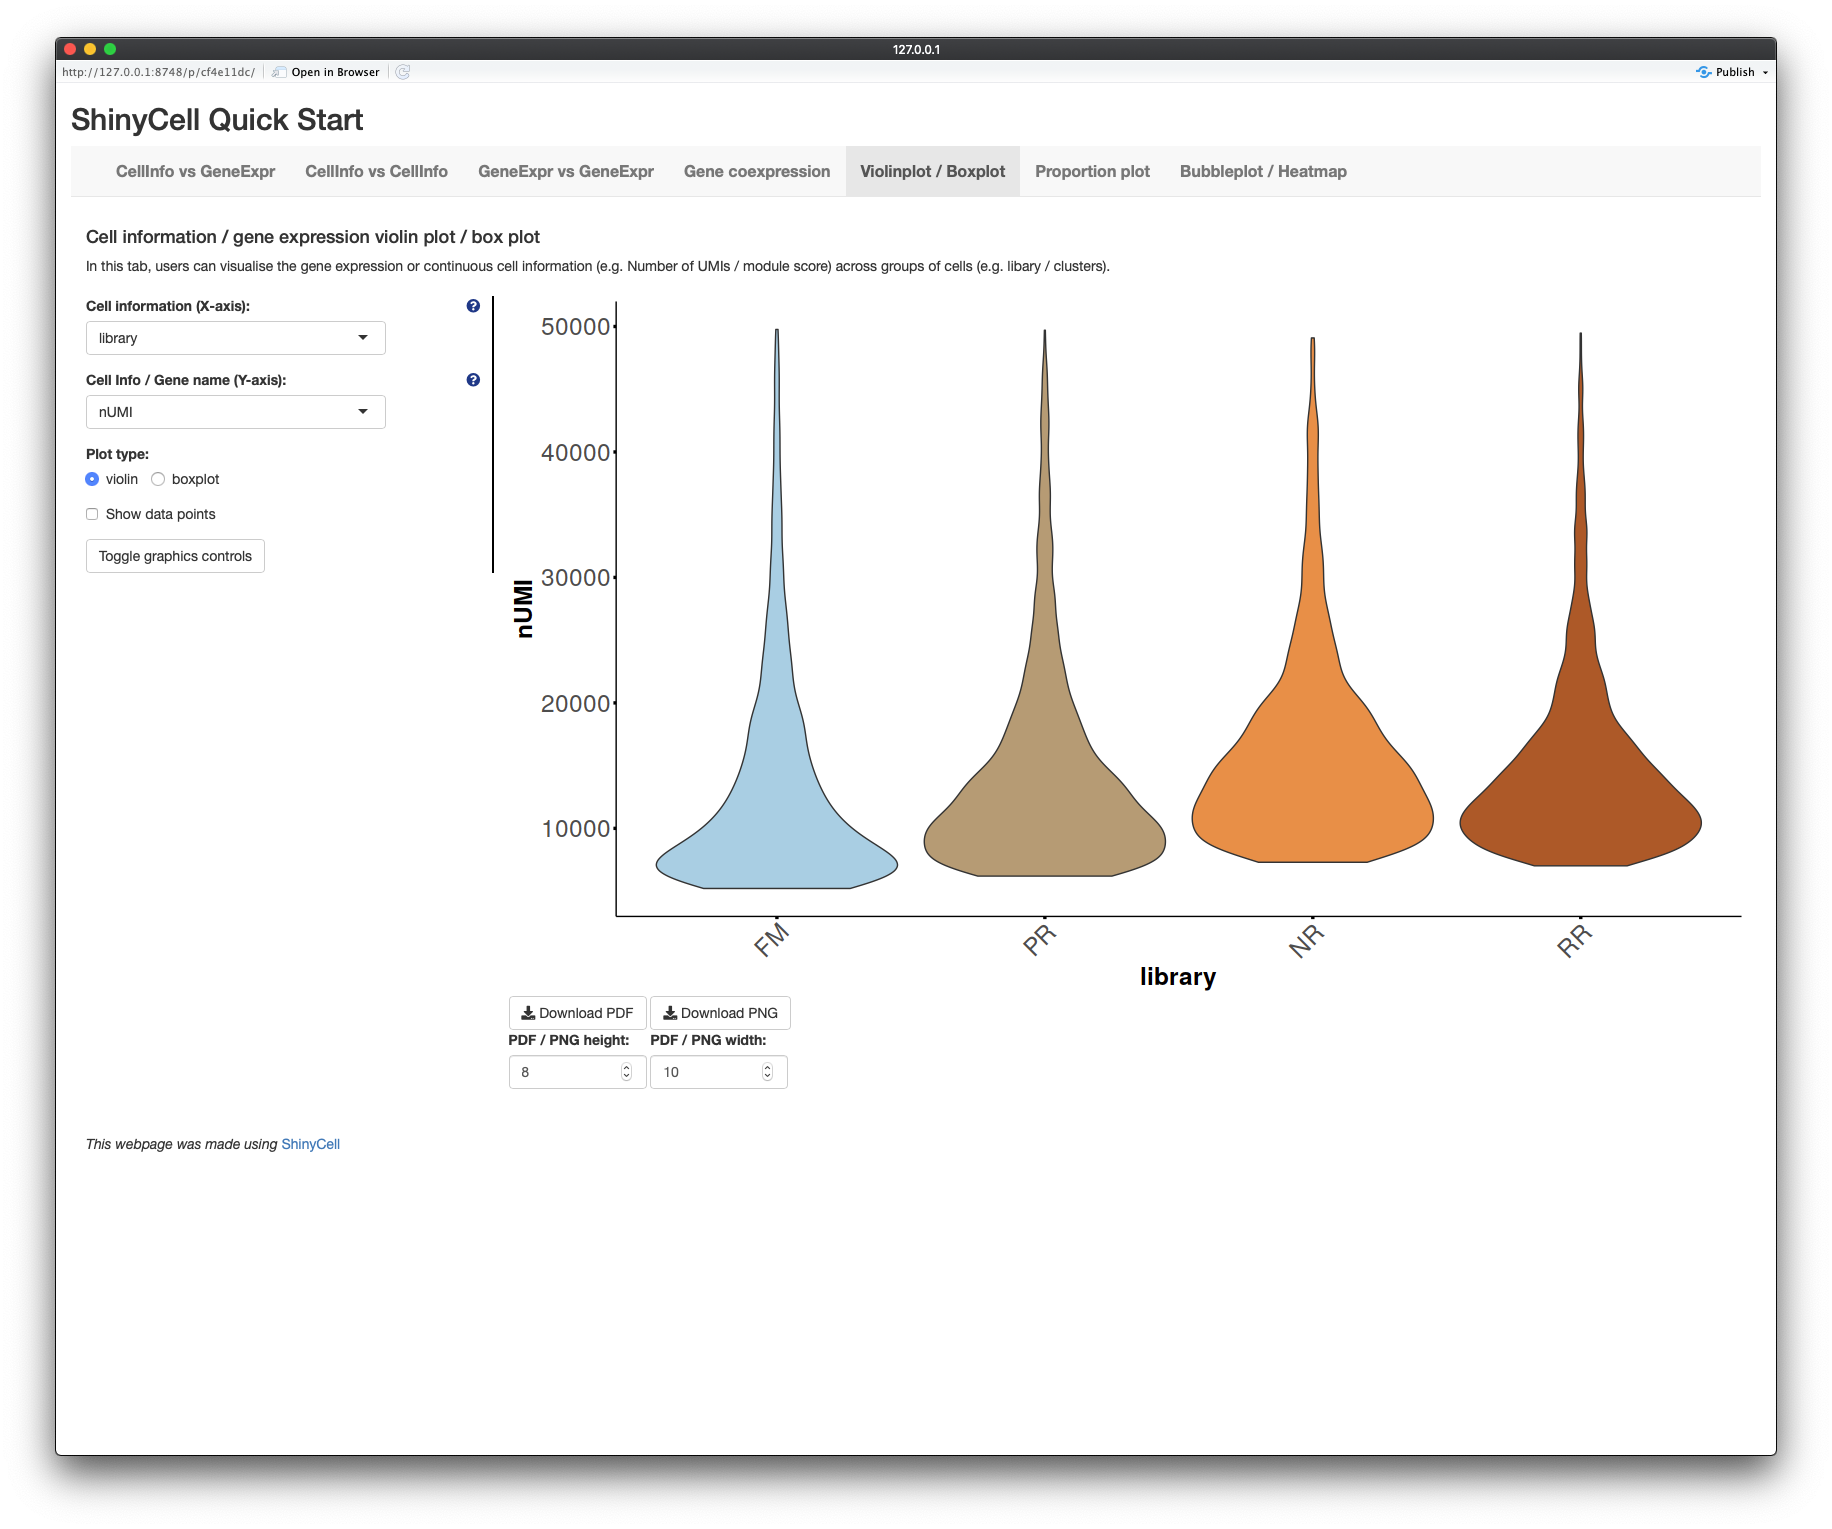
The fifth tab "Violinplot / Boxplot" plots the distribution of continuous cell information e.g. nUMI or module scores or gene expression across each cluster / group using violin plots or box plots.
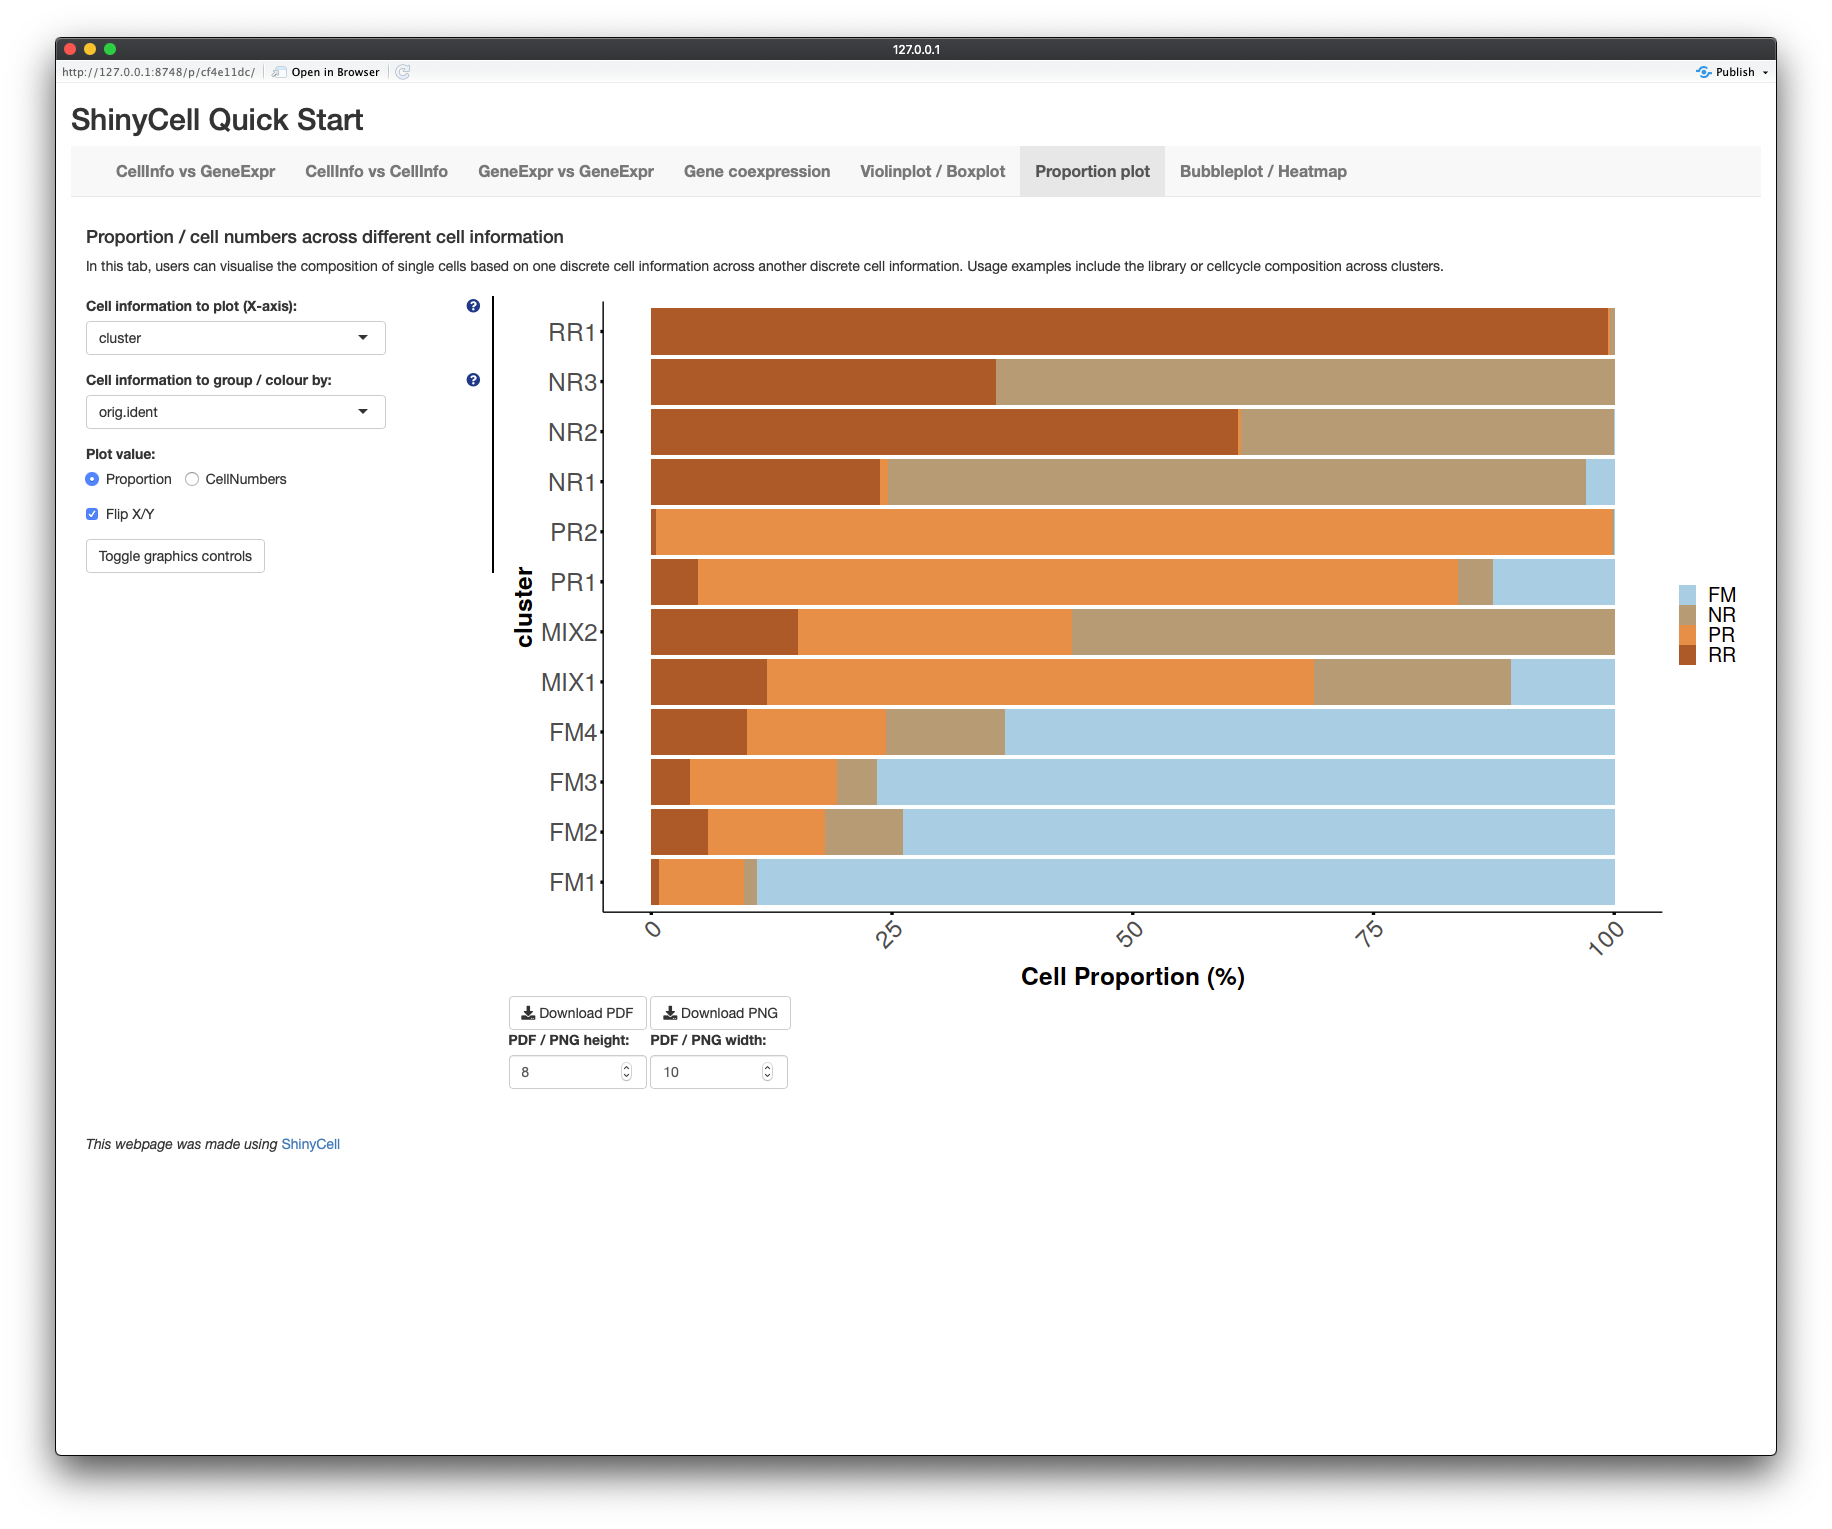
The sixth tab "Proportion plot" plots the composition of different clusters / groups of cells using proportion plots. Users can also plot the cell numbers instead of proportions.
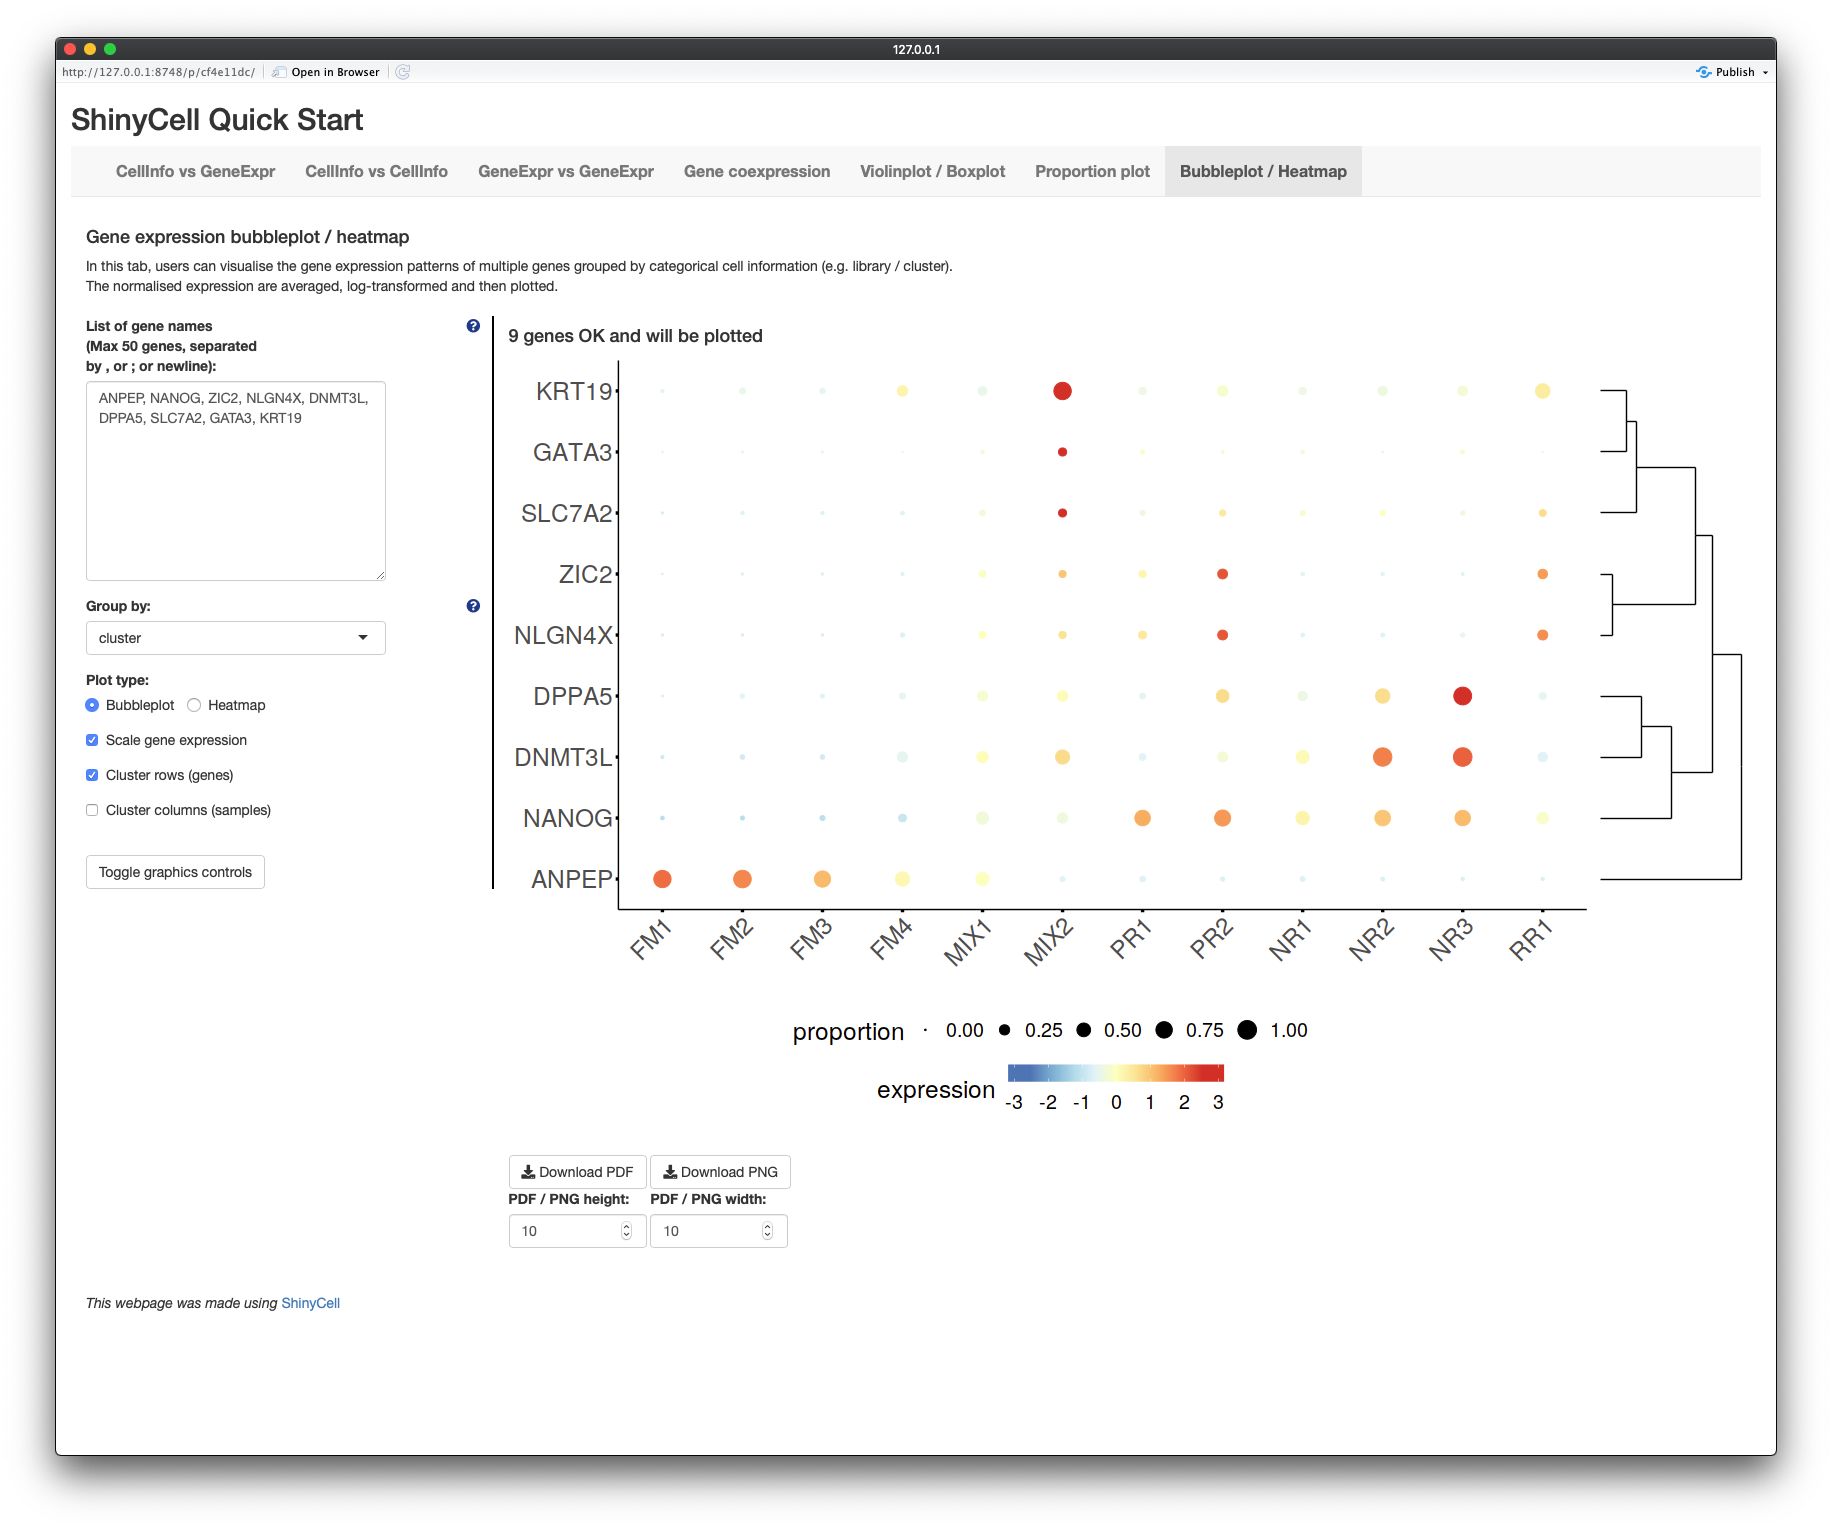
The seventh tab "Bubbleplot / Heatmap" allows users to visualise the expression of multiple genes across each cluster / group using bubbleplots / heatmap. The genes (rows) and groups (columns) can be furthered clustered using hierarchical clustering.
-
Q: How much memory / storage space does
ShinyCelland the Shiny app consume?- A: The Shiny app itself consumes very little memory and is meant to be a heavy-duty app where multiple users can access the app simultaneously. Unlike typical R objects, the entire gene expression matrix is stored on disk and not on memory via the hdf5 file system. Also, the hdf5 file system offers superior file compression and takes up less storage space than native R file formats such as rds / Rdata files.
- A: It should be noted that a large amount of memory is required when building the Shiny app. This is because the whole Seurat / SCE object has to be loaded onto memory and additional memory is required to generate the required files. From experience, a typical laptop with 8GB RAM can handle datasets around 30k cells while 16GB RAM machines can handle around 60k-70k cells.
-
Q: I have generated additional dimension reductions (e.g. force-directed layout / MDS / monocle2 etc.) and would like to include them into the Shiny app. How do I do that?
- A:
ShinyCellautomatically retrieves dimension reduction information from the Seurat or SCE object. Thus, the additional dimension reductions have to be added into the Seurat or SCE object before runningShinyCell. - For Seurat objects, users can refer "Storing a custom dimensional reduction calculation" in https://satijalab.org/seurat/v3.0/dim_reduction_vignette.html
- For SCE objects, users can refer to https://bioconductor.org/packages/devel/bioc/vignettes/SingleCellExperiment/inst/doc/intro.html#3_Adding_low-dimensional_representations
- A:
-
Q: I have both RNA and integrated data in my Seurat object. How do I specify which gene expression assay to plot in the Shiny app?
- A: Only one gene expression assay can be visualised per dataset. To
specify the assay, use the
gex.assay = "integratedargument in themakeShinyApp()ormakeShinyFiles()functions. If users want to visualise both gene expression, they have to treat each assay as an individual dataset and include multiple datasets into a single shiny app, following the Tutorial for creating a ShinyCell app containing several single-cell datasets
- A: Only one gene expression assay can be visualised per dataset. To
specify the assay, use the

