![]()
Chromatin ImmunoPrecipitation Sequencing Analysis Pipeline
Inherently Simple ChIP-Seq Analysis
Developed by Jeremiah Suryatenggara and Mahmoud A. Bassal
ChIP-Seq is a technique used to analyse protein-DNA interactions and identify the binding sites of said protein. A key step in the bioinformatics analysis is the calling of “peaks,” or regions of enrichment, corresponding to binding sites of the protein to the DNA.
It has been widely reported that of all the bioinformatics analysis steps, the step most likely to affect study outcome is peak calling (Chen et al., 2012; Johnson et al., 2007). Numerous reviews (Koohy et al., 2014; Laajala et al., 2009; Wilbanks and Facciotti, 2010) have been published benchmarking peak callers to ascertain superiority of one caller over others. Consistently however, these benchmarks report mixed, potentially conflicting, findings with no single peak caller out-performing others. Rather, each peak-caller excels in specific types of datasets and one cannot know the overall best performance of a single peak-caller in advance. Using a sub-optimal peak caller will result in few peaks called that do not accurately describe the binding landscape of the investigated protein, or worse, report a large number of false-positive peaks which, short of validating every peak manually, will be indiscernable from true-positive peaks. Compounding issues further, benchmarking reviews have consistently shown little overlap between called peak sets of different peak callers. Therefore, we can conclude that each peak caller has distinct selectivity and specificity characteristics which are often not additive and seldom completely overlap in many scenarios. As such, results obtained from individual peak callers, even sub-optimal callers, will contain sub-sets of true and false-positive peaks that are exclusive to that caller.
This leads the user to the peak-caller dilemma, if there is no universal peak caller to use, which peak caller does one use for their dataset? We therefore rationalized that without a perfect peak caller (which is near impossible owing to the significant variability introduced from wet-lab experiments), the only option is to leverage the best performing, currently available peak callers and identify unique and/or overlapping peaks to better discern the confidence of peaks without manual validation, and identify overlapping, high-confidence peak sub-sets.
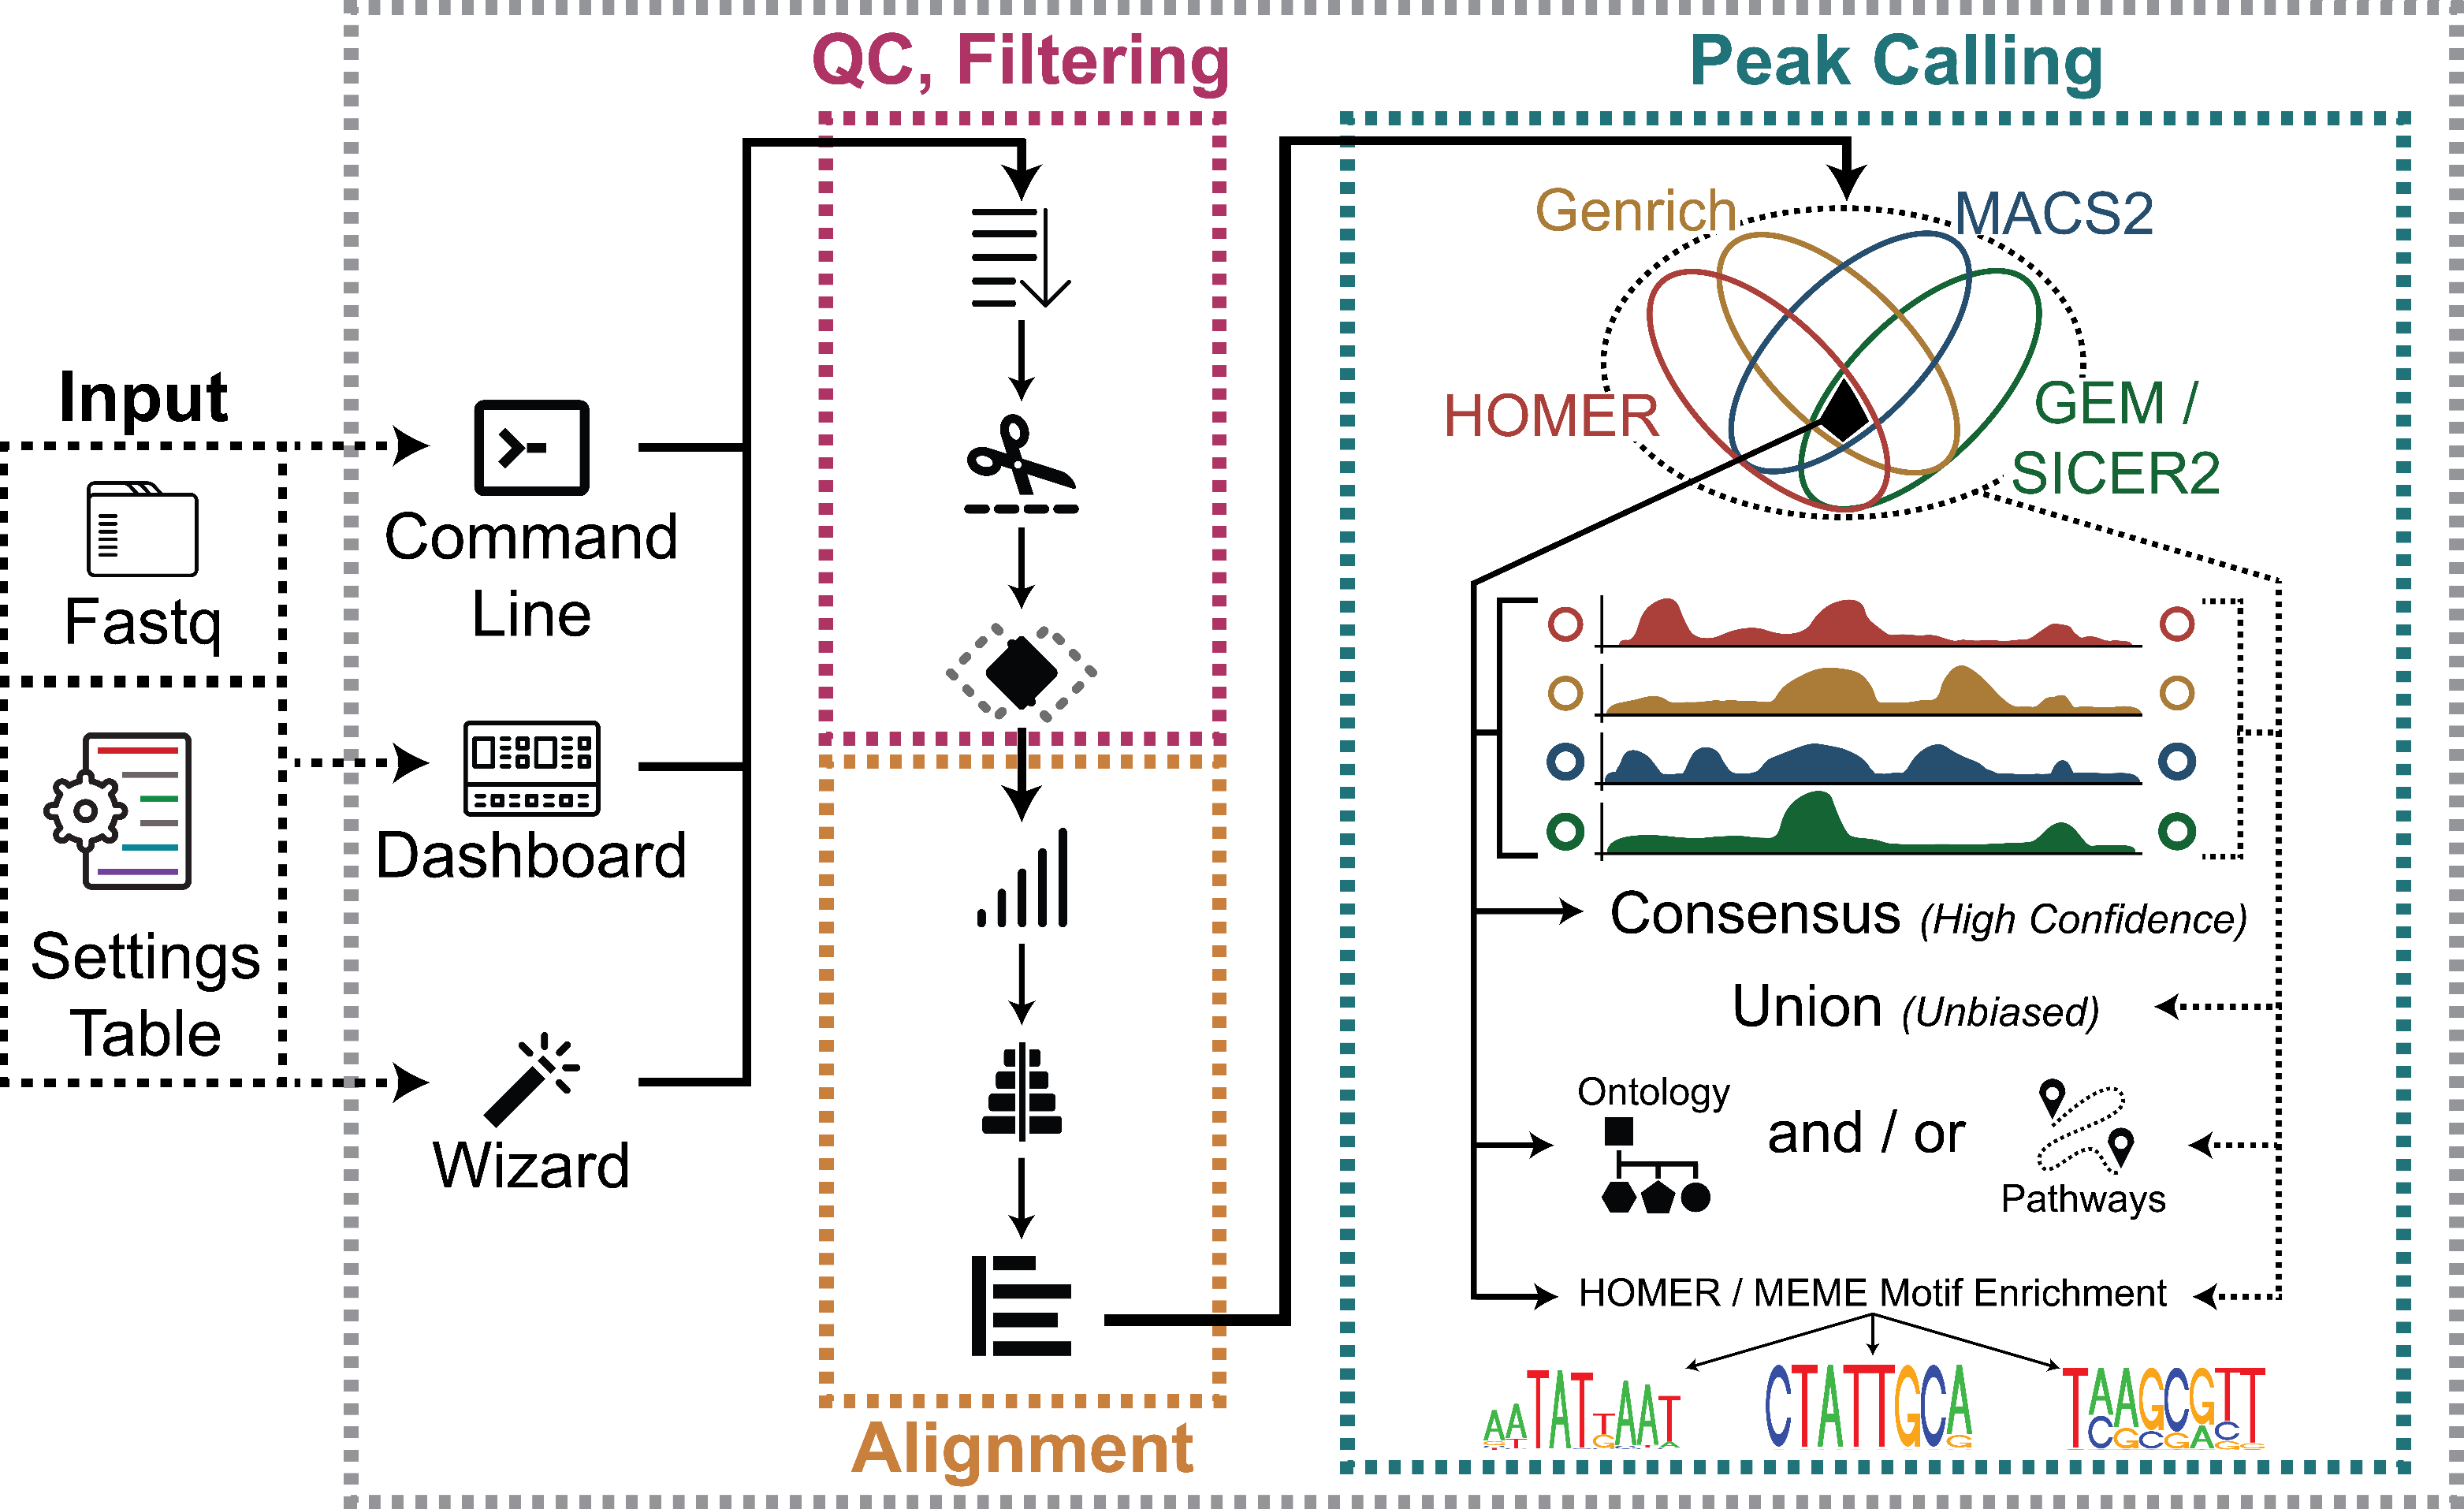
To that end, our ChIP-Seq Analysis Pipeline (ChIP-AP) utilizes multiple peak callers, which enables peak calling and merging of results from multiple peak callers (MACS2, GEM/SICER2, HOMER, and Genrich) to:
-
Selectively obtain high confidence peaks based on overlaps by different peak callers
-
Avoid the caveats of depending on a single peak caller in datasets with different peak characteristics and signal-to-noise ratios
-
Freely choose the “sweet spot” between the consensus peaks set (intersection of detected peaks from all peak callers) and the total peaks set (the union of all detected peaks), that answers one’s biological questions which may be supported by additional evidence from other experiments. This can be done from the output without re-processing data.
ChIP-AP is a fully automated ChIP-seq data processing and analysis pipeline:
-
For input, it takes unaligned sequencing reads in fastq format (extension: .fastq / .fq / .fastq.gz / .fq.gz) or previously aligned reads in bam format (extension: .bam) from any aligner
-
ChIP-AP is capable of processing and analyze multiple sample replicates
-
ChIP-AP is a complete, integrated workflow which performs all analysis steps (QC, cleanup, alignment, peak-calling, pathway analysis) and outputs a final integrated peak set
-
The output of ChIP-AP is a detected peaks list, annotated with information on associated gene names, IDs, functions, gene ontology, and related pathways
OS – Linux (Ubuntu-variants 16.04+ tested), MacOS (10.13+), Windows 10 (v1903+)
CPU – (minimum) Quad-Core Intel/AMD CPU, (recommended) Octa-Core Intel/AMD CPU. ChIP-AP will NOT run on newer Apple Silicon (M1) CPU’s – not yet anyways…
RAM – (minimum) 8Gb, (recommended) 16Gb+
Storage (SSD/HDD) – This varies widely depending on the samples being processed and the sequencing depth. Rough estimate, (minimum) 30Gb, (recommended) 100Gb+
Screen Resolution – A minimum resolution of 1920*1080 is required for the dashboard interface. If your screen resolution is less than this, you will be limited to only using the wizard
For users who do not wish to try to configure things on their own, we provide 2 usage options:
-
Users can download a pre-configured virtual-machine image to run in VirtualBox (Oracle VM VirtualBox). A detailed tutorial can be found on our wiki here.
-
Users can use the Cancer Science Institute of Singapore’s Next-Generation Sequencing Portal (CSI NGS Portal, (An et al., 2020)).
Using the NGS Portal, users can upload their data to a secure processing server, setup a ChIP-AP run, and wait for the results. This option does not require users to set anything up on their local machines, simply upload your data and use the service. Data uploaded is accessible only to your user account and not shared publically. Data and analyses are deleted from the server after 10 days. This is an ideal option if you will only do few analyses or do not have the hardware to run ChIP-AP yourself – and can be done without a bioinformatician's input. The pipeline will run with default parameters and so no configuration is required although the option to upload the custom settings table does still exist (more details on this later and in our detailed documentation).
ChIP-AP has been designed to be as simple as possible to run for end-users, be they bioinformaticians or wet-lab biologists with no coding experience. For non-experienced users a little command-line dabbling is required in order to get everything set up just right however. We have prepared full installation guides and wiki’s located here on our github for your operating system (OS) of choice (look at the top you will see a “Wiki” tab). These are complete step-by-step guides with accompanying screenshots to walk users through every step of the installation processes. For fresh installations, we have not encountered issues when following our installation instructions accurately. If you have previous instalaltions of configurations, some tweaking may be necessary to get everything to work right – just be aware.
For advanced users, the installation instructions are as follows:
1 - Download the chipap_installation zip in our github repo and unzip in the folder of your choosing.
wget https://github.com/JSuryatenggara/ChIP-AP/raw/main/chipap_installation.zip
2 - Download the pre-generated, required genome files from our dropbox and unzip in the same folder as the ChIP-AP scripts – ie
<path>…/chipap_installation/chipap_scripts/
3 - Anaconda3 is required for ChIP-AP to install and run. If you have already installed Anaconda3 on your machine, proceed to the next step. If you need to setup Anaconda3, download the required command-line installer from Anaconda using wget. We recommend isntalling anaconda with default settings and when prompted at the end of the installation, initialize the base conda environment.
Before continuing, you must close and re-open the terminal to initialize conda.
4 - In a new terminal window, you should now see (base) written to the left of the command prompt, this tells you conda has been properly initialized. If it hasn’t been initialized, refer to the conda documentation, section "Should I add Anaconda to the macOS or Linux PATH?"
5 - Next navigate to the chipap_installation folder. Check that the chipap_installer.py script is executable (if not, run the command)
chmod +x ./chipap_installer.py
and then execute it. The installer will then ask you a couple of questions regarding installing in its own environment (highly recommended) and then proceed to install everything and all dependencies. Depending on your CPU and internet speeds this will take a while as it needs to download ~10-15Gb of genome data for HOMER.
6 - Once done, to use ChIP-AP, if you installed in its own conda environment you must activate the conda environment before each run. Otherwise, you can simply run
chipap_vxx.py
chipap_wizard.py
chipap_dashboard.py
depending on your preference of running.
ChIP-AP is capable of handling multiple sample replicates in a single run. It is also capable of hanlding an un-balanced number of sample replicates (ie 3 ChIP, 2 Controls). It does so by merging each corresponding sample type (so merge all ChIP samples together and merge all control samples together) following read alignment and these merged files are used for all down-stream processing.
For controls, input (not IgG) is recommended and is consensually considered best practice.
For peak calling, peaks are called as ChIP over control.
chipap  --mode single
        --chipR1 [chip fastq replicate1] [chip fastq replicate2] …
        --ctrlR1 [control fastq replicate1] [control fastq replicate2] …
        --genome [path to genome folder]
        --output [path to output save folder]
        --setname [dataset name]
chipap  --mode paired
        --chipR1 [chip fastq replicate1, first read] [chip fastq replicate2, first read] …
        --chipR2 [chip fastq replicate1, second read] [chip fastq replicate2, second read] …
        --ctrlR1 [control fastq replicate1, first read] [control fastq replicate2, first read] …
        --ctrlR2 [control fastq replicate1, second read] [control fastq replicate2, second read] …
        --genome [path to output save folder]
        --output [path to output save folder]
        --setname [dataset name]
chipap	--mode single / paired
        --chipR1 [chip bam replicate1] [chip bam replicate2] …
        --ctrlR1 [control bam replicate1] [control bam replicate2] …
        --genome [path to genome folder]
        --output [path to output save folder]
        --setname [dataset name]
The command line that was used to call the pipeline will be located in a text file: _[setname]command_line.txt in the output save folder. This is useful for documentation of the run, and for re-running of the pipeline after a run failure or some tweaking if need be. For example:
chipap_xx.py --mode paired --ref hg38 --genome [path_to_genome_folder] --output [full_path_to_output_save_folder] --setname [dataset name] --sample_table [path_to_sample_table_file] --custom_setting_table [path_to_setting_table_file].tsv --motif [path_to_known_motif_file] --fcmerge --goann --pathann --deltemp --thread [#_of_threads_to_use] --run
| Argument/Flag | Possible Values | Detailed Explanation |
|---|---|---|
| --mode | single / paired | Single-end or paired-end sequencing analysis. If a paired-end run, files will typically be labelled ending in *_R1 and *_R2 before the file extension. If these labels aren’t present then likely, you have single-ended sequencing data and select the “single” option. |
| --genome | [directory] | Your genome folder directory. Requires full path, not relative path. This is the folder where the pre-computed genome alignment and processing files are saved. These genomes can be downloaded from (https://www.dropbox.com/s/073mpy8aho4vjda/chipap_genomes.zip?dl=0) or instead you can compute your own (a guide for this is coming soon actually… Keep an eye on the wiki…) |
| --output | [directory] | Your desired output folder. Requires full path, not relative path. |
| --setname | [text] | The prefix to label output and intermediate files (no space allowed). ChIP-AP will rename all processed data files to have this “setname” prefix. |
| Argument/Flag | Possible Values | Detailed Explanation |
|---|---|---|
| --peak | narrow / broad | Narrow peaks for transcription factors (default). Broad peaks for histone modifiers. If unsure what will work best for your dataset, you may need to run ChIP-AP once in each mode and inspect the output to ensure you get what you want from the results. Pay close attention to the width of the peaks called and regions of enrichment. |
| --chipR1 | [repl1 repl2 …] | Your ChIP datasets: ordered by replicate, separated by space. Best to include full path rather than relative paths. |
| --chipR2 | [repl1 repl2 …] | [ Paired-end Only ] Your ChIP datasets second read: ordered by replicate, separated by space. Best to include full path rather than relative paths. |
| --ctrlR1 | [repl1 repl2 …] | Your control datasets: ordered by replicate, separated by space. Best to include full path rather than relative paths. |
| --ctrlR2 | [repl1 repl2 …] | [ Paired-end Only ] Your control datasets second read: ordered by replicate, separated by space. Best to include full path rather than relative paths. |
| --sample | [file] | Rather than including the input sample file names and paths on the commandline, one can make a sample table containing the same information and input this instead. The sample-table is a 4*n-sized table (with n = number of replicates) containing the absolute paths to each of your ChIP and control replicates (See below for more information regarding this file and its layout). When this option is used, this table will disregard any assigned values to --chipR1, --chipR2, --ctrlR1, and --ctrlR2. |
| --setting | [file] | [ For Advanced Users ONLY ] The settings-table allows you to fine-tune the behaviour of every program as part of ChIP-AP. Hence very disasterous if you get wrong! If you are unsure even a little about what you’re doing, then stick to default settings please – this goes even for bioinformaticians. This txt file is a 2*n-sized table (with n = number of replicates) containing custom arguments for every program as part of ChIP-AP. The default settings table is provided in the genome folder. You can COPY this file and make changes as necessary. To use your customs settings table, provide full path to updated txt file. |
| --ref | hg19 / hg38 / mm9 / mm10 / dm6 / sacCer3 |
Your sample genome reference build. Default is hg38 (human). The genomes listed to the left are provided, pre-calculated by us and are the only genomes used and tested for now. We will provide added functionality soon to add your own custom genome to ChIP-AP. Watch this space (actually the github…)! |
| --motif | [file] | Your predicted/known motif file, in HOMER matrix format (.motif). If provided, once peaks are called, HOMER motif discovery will be run on the total called peak set for this motif. Many users prefer MEME-ChIP instead… we know… WIP :) |
| --fcmerge | This flag will force fold change analysis to be computed based on merged replicates instead of on each replicate seperately. | |
| --goann | This flag will instruct to annotate peaks with all relevant GO terms as provided by HOMER. | |
| --pathann | This flag will instruct to annotate peaks with all relevant pathway and interaction enrichment terms as provided by HOMER. | |
| --deltemp | This flag will instruct to delete large intermediary files right after they are not going to be used for further processes (eg intermediary fq files. This option will save a significant amount of space by the end of your analysis, so recommended. | |
| --thread | [integer] | Maximum number of processes to use. Default is half the maximum available on your system so as to not choke it during the run. If running on a laptop or low-thread count cpu, best to push this up to maximum number threads available -1 – but this will significantly slow your laptop if attempting other tasks while ChIP-AP is running. |
| --run | Use to immediately run the suite by running the master script. This is the big red button ok... Use at your own risk! When not used, the generated master script (MASTER_script.sh) in the output folder can be run manually by user. We have made sure that when you tell ChIP-AP “do not press the big red button” that it will behave and do as you say. |
|
| --homer_motif | consensus / union / both |
This flag will instruct HOMER (findMotifsGenome.pl) to perform motif enrichment analysis at the end of the pipeline run. |
| --meme_motif | consensus / union / both |
This flag will instruct MEME (meme-chip) to perform motif enrichment analysis at the end of the pipeline run. |
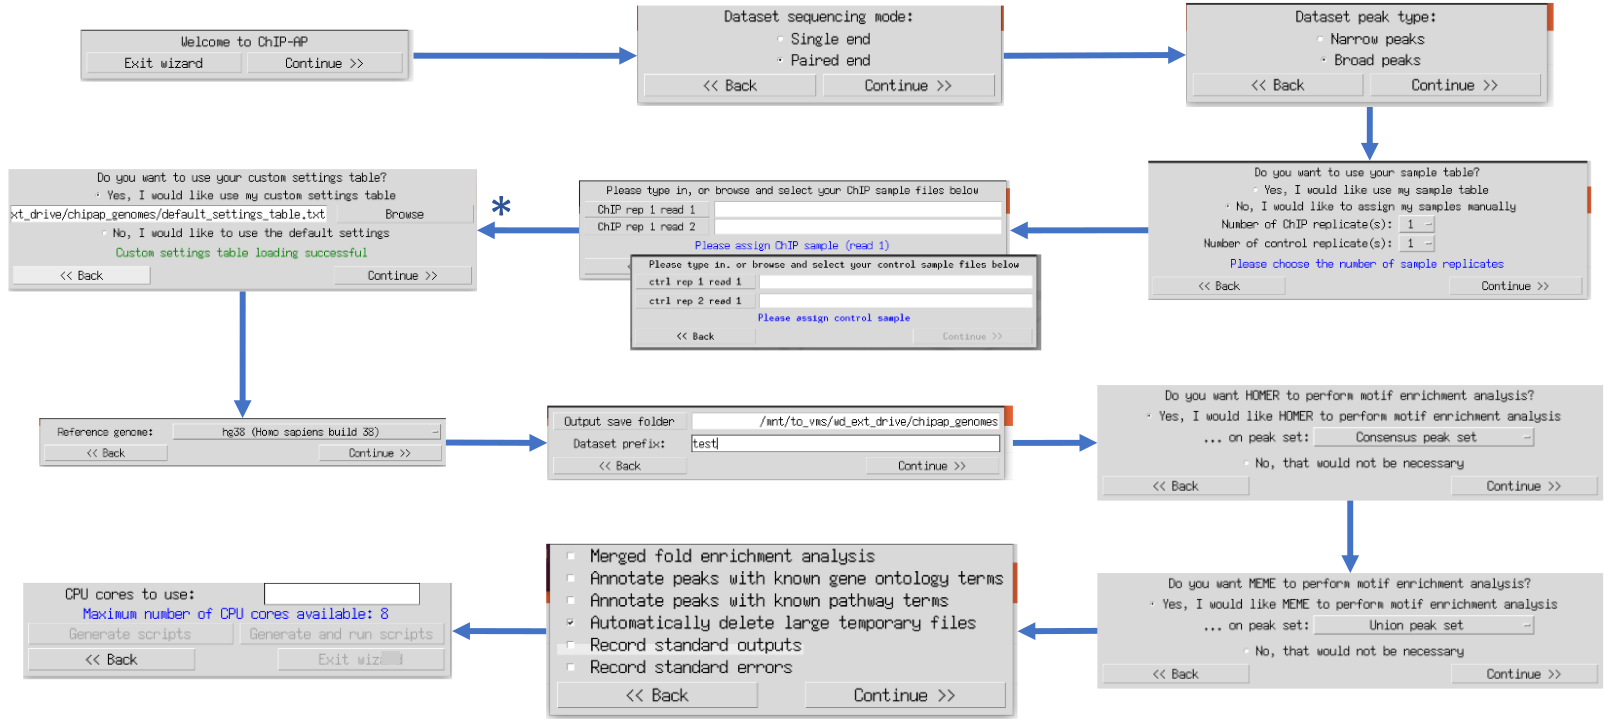
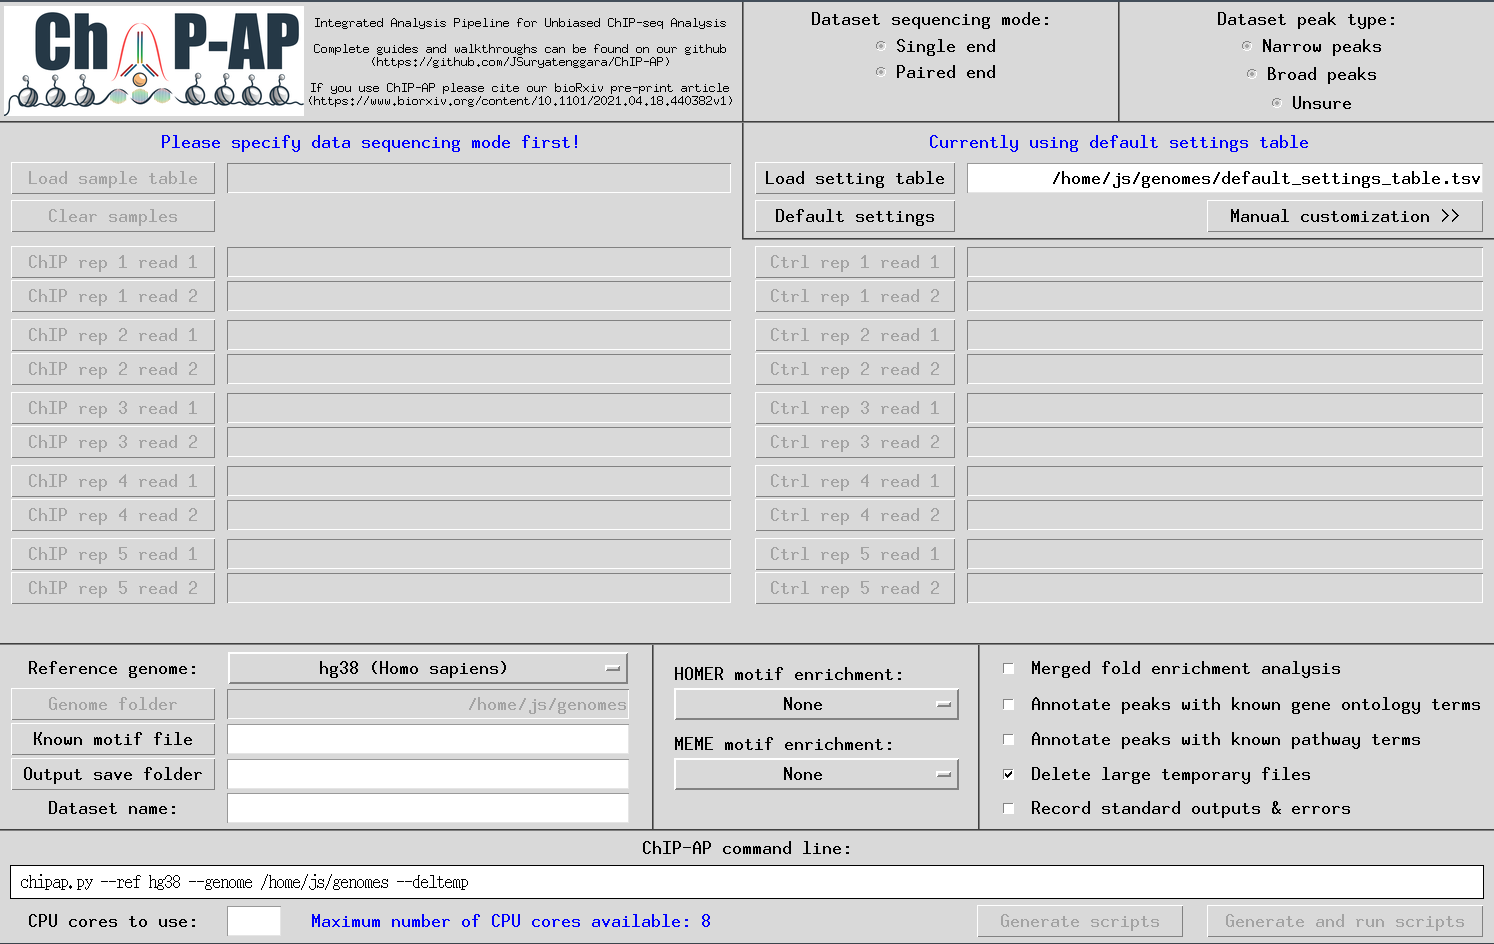
ChIP-AP offers 2 graphical interfaces for running – depending on a users proficiency with ChIP-AP. They are the chipap_dashboard and the chipap_wizard.
We recommend new users to ChIP-AP first use the wizard. Proficient users of ChIP-AP should use the dashboard as it enables inputting the data more quickly.
Once ChIP-AP is setup, at the command line type:
chipap_wizard.py
to use the wizard graphical user interface (GUI). The multiple windows that appear ask users questions sequentially regarding information required for a run. This ensure data is provided in the correct order without overwhelming the user with all questions and options simultaneously. This option is therefore recommended for inexperienced ChIP-AP users. Tooltip boxes appear over entry fields providing brief explanations of input requirements.
Once ChIP-AP is setup, at the command line type:
chipap_dashboard.py
The GUI below will appear enabling users to input everything required for a run. Tooltip boxes will appear over each field providing brief explanations of whats required in said field.
A customized pipeline run is possible by providing the required flag arguments for each individual program in the pipeline at the * stage above. By selecting the right option, a secondary window will appear containing multiple entry fields for such flag arguments. This option is for advanced users only. For valid flags, please refer to the documentation of each program specifically as each program has different flags and syntax for its parameters.
The table below shows the contents of [setname]_all_peaks_go_pathway_annotated.tsv. Smaller sized and less verbose variants of this table are saved in the output folder with suffixes: concatenated, annotated, and calculated (see Source in the table below)
| Column # | Peak Attribute | Source |
|---|---|---|
| Column 1 (A) | Peak ID (unique peak ID) |
Pipeline script: 22_peaks_ processing _script.sh Called program: cat (Bash) Output file: [setname]_all_peaks_concatenated.tsv Output folder: 22_peaks_processing |
| Column 2 (B) | Chr (chromosome) | |
| Column 3 (C) | Start (peak start coordinate) | |
| Column 4 (D) | End (peak end coordinate) | |
| Column 5 (E) | Strand (on which peak is found) | |
| Column 6 (F) | Peak Caller Combination | |
| Column 7 (G) | Peak Caller Overlaps |
Pipeline script: 22_peaks_processing_script.sh Called script: fold_change_calculator_suite_xx.py Output file: [setname]_all_peaks_calculated.tsv Output folder: 22_peaks_processing |
| Column 8 (H) | ChIP Tag Count | |
| Column 9 (I) | Control Tag Count | |
| Column 10 (J) | Fold Change | |
| Column 11 (K) | Number of Motifs | |
| Column 12 (L) | Annotation |
Pipeline script: 22_peaks_processing_script.sh Called program: HOMER annotatePeaks Output file: [setname]_all_peaks_annotated.tsv Output folder: 22_peaks_processing |
| Column 13 (M) | Detailed Annotation | |
| Column 14 (N) | Distance to TSS | |
| Column 15 (O) | Nearest PromoterID | |
| Column 16 (P) | Entrez ID | |
| Column 17 (Q) | Nearest Unigene | |
| Column 18 (R) | Nearest Refseq | |
| Column 19 (S) | Nearest Ensembl | |
| Column 20 (T) | Gene Name | |
| Column 21 (U) | Gene Alias | |
| Column 22 (V) | Gene Description | |
| Column 23 (W) | Gene Type | |
| Column 24 (X) | CpG% | |
| Column 25 (Y) | GC% | |
| Column 26 (Z) | Biological Process |
Pipeline script: 23_go_annotation_script.sh Called script: GO_annotate_suite_xx.py Output file: [setname]_all_peaks_go_annotated.tsv Output folder: 23_supplementary_annotations |
| Column 27 (AA) | Molecular Function | |
| Column 28 (AB) | Cellular Component | |
| Column 29 (AC) | Interaction with Common Protein |
Pipeline script: 23_pathway_annotation_script.sh Called script: pathway_annotate_suite_xx.py Output file: [setname]_all_peaks_pathway_annotated.tsv Output folder: 23_supplementary_annotations |
| Column 30 (AD) | Somatic Mutations (COSMIC) | |
| Column 31 (AE) | Pathway (KEGG) | |
| Column 32 (AF) | Pathway (BIOCYC) | |
| Column 33 (AG) | Pathway (pathwayInteractionDB) | |
| Column 34 (AH) | Pathway (REACTOME) | |
| Column 35 (AI) | Pathway (SMPDB) | |
| Column 36 (AJ) | Pathway (Wikipathways) |
This file summarizes the assignment of the files (IP sample or control, read 1 or 2; replicate number) and the file name conversion for every unaligned or aligned sequencing reads to be processed. Each line tells the user what the original files have been renamed into. Check this file if you suspect the order of samples were incorrectly entered (i.e., swapped chip with control)
Chromatin IP dataset replicate 1, 1st read : Original filename = a.fastq --> New filename = setname_chip_rep1_R1.fq.gz

Chromatin IP dataset replicate 2, 1st read : Original filename = b.fastq --> New filename = setname _chip_rep2_R1.fq.gz

Chromatin IP dataset replicate 1, 2nd read : Original filename = c.fastq --> New filename = setname _chip_rep1_R2.fq.gz

Chromatin IP dataset replicate 2, 2nd read : Original filename = d.fastq --> New filename = setname _chip_rep2_R2.fq.gz

Control dataset replicate 1, 1st read : Original filename = e.fastq --> New filename = setname _ctrl_rep1_R1.fq.gz

Control dataset replicate 2, 1st read : Original filename = f.fastq --> New filename = setname _ctrl_rep2_R1.fq.gz

Control dataset replicate 1, 2nd read : Original filename = g.fastq --> New filename = setname _ctrl_rep1_R2.fq.gz

Control dataset replicate 2, 2nd read : Original filename = h.fastq --> New filename = setname _ctrl_rep2_R2.fq.gz
Contains the full path of each input ChIP and control sample in the pipeline run in a tab-separated value file: [setname]_sample_table.tsv in the output save folder in ChIP-AP sample table format. This is useful for documentation of the run, and for re-running of the pipeline after a run failure or some tweaking if need be. Below is an example of sample table file content (header included), given paired-end samples with two ChIP replicates and two control replicates:
| chip_read_1 | chip_read_2 | ctrl_read_1 | ctrl_read_2 |
|---|---|---|---|
| ... /a.fastq | ... /c.fastq | ... /e.fastq | ... /g.fastq |
| ... /b.fastq | ... /d.fastq | ... /f.fastq | ... /h.fastq |
If your sample is single-ended, then the '..._read_2' columns can be simple be left blank, or the sample table can be simplified to as follows:
| chip_read_1 | ctrl_read_1 |
|---|---|
| ... /a.fastq | ... /e.fastq |
| ... /b.fastq | ... /f.fastq |
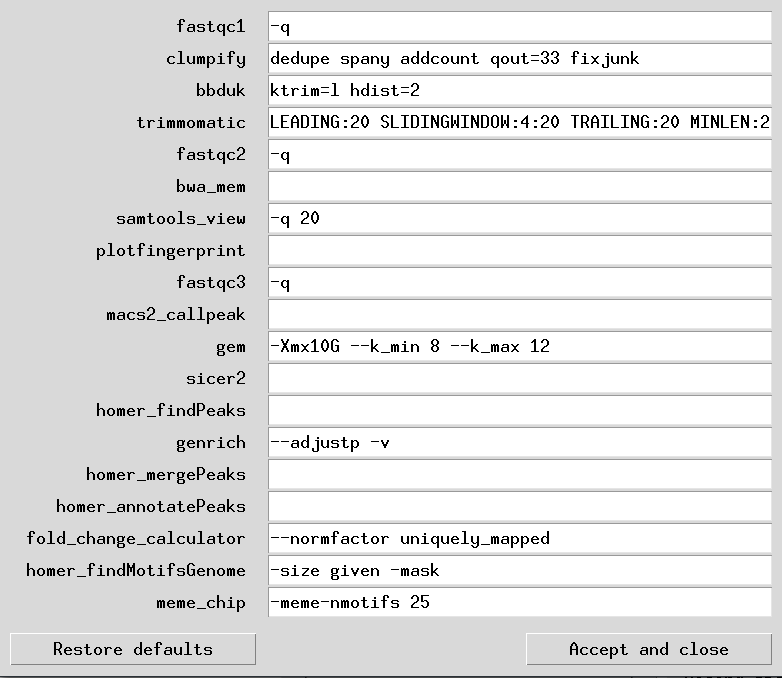
A cornerstone of ChIP-AP’s functionality is the settings table. ChIP-AP, with the raw fq files and the settings table, is able to reproduce (near) identically any analysis that was performed (provided the same program version numbers are used). The ‘near identically’ statements is owing to the fact that reported alignments of multi-mappers may, in some cases, give every so slightly different results. This ambiguity can be alleviated however by filtering out alignments with low MAPQ scores in the corresponding alignment filter step, post-alignment to ensure consistent results from every analysis run. The provision of the settings table therefore ensures reproducibility of any analysis with minimal effort and bypasses the usually sparse and significantly under-detailed methods sections of publications. Science is supposed to be reproducible, yet bioinformatics analysis are typically black-boxes which are irreproducible. This 1 file, changes that!
The structure of the settings table is simple. It is a 2 column tab-separated value file with the names of the programs on the 1st column, and the necessary flags required or changed in the 2nd column. If making your own custom table, then the 1st column below must be copied as-is and not changed. These 2 columns together, list the flags and argument values for each program used in the pipeline.
When ChIP-AP is run, a copy of the used settings table is saved as a tab-separated value file: [setname]_ setting_table.tsv in the output save folder.
If you have a custom settings table made and provided it as input, then ChIP-AP will make a 2nd copy of this table in the same output save folder. This decision is made as it is useful documentation of the run performed. This file is also useful for re-running of the pipeline after run failure or some tweaking if necessary. If submitting an issue request on Github, you must provide us your settings table used as well as all other requested information. See Github for details regarding this.
We consider the dissemination of the information of this file as vital and essential along with results obtained. The table can be included as a supplemental table in a manuscript or can be included as a processed data file when submitting data to GEO – either way, the information of this file must be presented when publishing data.
Below is an example of setting table file in its default-setting state:
Note: When running GEM, to ensure absolute reproducibility of all results every single run, you MUST add the flag "--t 1" to the DST below. When GEM is run in multi-threaded mode, its results are not reproducible over multiple runs even with the same parameters (although they are very close to each other). This is an issue we raised with the developers and is out of our hands. We highly doubt they will fix this aspect of GEM's behaviour. Therefore if 100% reproducibility of results is key for you, run in single-threaded mode only - even if it will take longer to run.
| program | argument |
|---|---|
| fastqc1 | -q |
| clumpify | dedupe spany addcount qout=33 fixjunk |
| bbduk | ktrim=l hdist=2 |
| trimmomatic | LEADING:20 SLIDINGWINDOW:4:20 TRAILING:20 MINLEN:20 |
| fastqc2 | -q |
| bwa_mem | |
| samtools_view | -q 20 |
| plotfingerprint | |
| fastqc3 | -q |
| macs2_callpeak | |
| gem | -Xmx10G --k_min 8 --k_max 12 |
| sicer2 | |
| homer_findPeaks | |
| genrich | --adjustp -v |
| homer_mergePeaks | |
| homer_annotatePeaks | |
| fold_change_calculator | --normfactor uniquely_mapped |
| homer_findMotifsGenome | -size given -mask |
| meme_chip | -meme-nmotifs 25 |
As can be seen, certain flags and values for some programs have been preset as per our testing and opinions. A point to note however, some flags for programs, such as -BAMPE in MACS2, are not listed since they are “hard-coded” into the pipeline and cannot be modified. For this example of -BAMPE in MACS2, this is “hard-coded” because this flag is essential for running peak calling in paired-end datsets. Parameters and flags like this that must be set are “hard-coded” and hidden and cannot be changed unless by choosing the appropriate narrow/broad run modes. A listing of all these “hard-coded” parameters can be found in our documentation.
For transcription factor samples (narrow peaks), ChIP weighted peak center coordinate is determined by the median coordinate of all reads in the peak region. Fold change was then calculated as read depth in ChIP sample divided by non-zero read depth of control sample at the weighted peak center coordinate.
For histone modifier samples (broad peak type), fold change was simply calculated based on average read depth in ChIP sample, divided by non-zero average read depth of control sample, along the same peak region.
To correct for read depth discrepancies due to imbalanced number of reads between ChIP and control samples, ChIP-AP uses one of three available normalization factors depending on the commandline flag specified:
- (Default) Based on only uniquely mapped reads in ChIP vs control bam files (filtered using samtools view -F256 and counted using samtools view -c)
- Based on only successfully mapped reads in ChIP vs control bam files (filtered using samtools view -F4 and counted using samtools view -c)
- Based on user-determined value.
Advanced users may choose to change this by changing the argument field for fold_change_calculator in the settings table as follows:
- --normfactor uniquely_mapped
- Default - based on uniquely mapped reads; default setting
- --normfactor mapped
- change to all mapped reads
- --normfactor user_value --chip_norm [x] --ctrl_norm [y]
- change to user-determined normalization factor, where x / y is the user-determined ratio of the number of ChIP reads to the number of control reads
Based on our testing, Genrich tends to misbehave when processing datasets with low read depth. It starts to call low enrichment regions as peaks, leaving users with an impossibly large number of called peaks. We contacted the developer of Genrich and confirmed such behaviour with them. Through our testing, we derived equations that allow us to curtail Genrich’s aberrant behaviour in such scenarios. This adjustment is performed and derived by us and is not attributed to Genrich and/or its developer(s).
To avoid the aforementioned peak calling depth issue, we curtail such behaviour by setting up an auto-adjusting p value threshold that responsively raises the default limit of peak’s minimum p value as the read depth gets lower using the following equations Q1, Q2, Q3.

Ok so ChIP-AP does report a fair amount of stuff. If you ran it locally you have a swath of folders and you have nooooo clue what to look for and its all confusing. We get that. The reality though its very simple to know what to look for to know your experimental run worked and in this section were going to walk you through that!
There are a couple of things to look for to answer this question. 1, the fingerprint plot and 2, the venn diagram of the merged peaks. Let's begin…
-
The Fingerprint Plot
The fingerprint plot tells us how well the enrichment of your samples worked. It is generated by the function from the deeptools package and is generated after the alignment files. As such, the plots are found in the “08_results” folder and are labelled “fingerprint_xxxxx.png/svg.” The PNG files allow you to view them in any image viewer, the SVG files are for opening in Adobe Illustrator or Inkscape to make HQ publication figures later if you need.
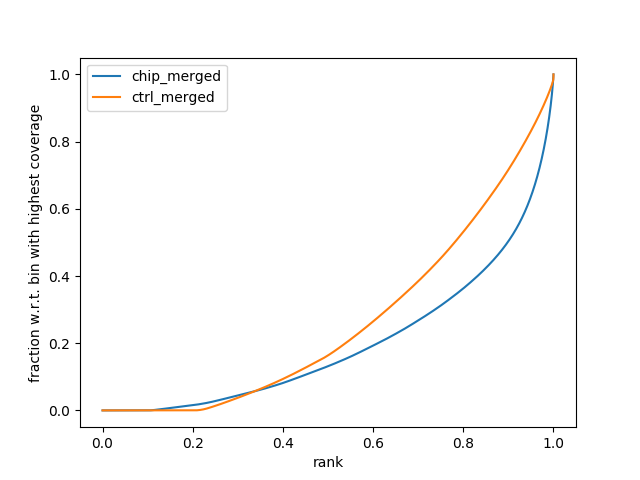
In this example, there is reasonable enrichment in our chip samples. And so we are confident we can see enrichment.
-
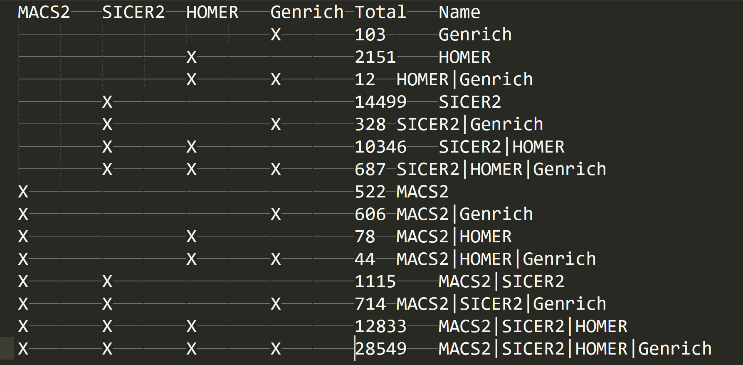
The Venn Diagram (well Venn Text)
In the folder “21_peaks_merging” folder, you will find the “venn.txt” file. This will show you a textual venn diagram of the overlap between the called peaks across all peak callers. To know your experiment worked well, then you should see a full list with combinations of all peak callers and relatively large numbers for the consensus peak sets (ie peaks called by multiple peak callers) – this is the ideal case. However, from our experiences, there will almost always be 1 maybe 2 peak callers that don’t like a dataset for some reason and so you may find a peak caller performed poorly but the others performed admirably. This is still a good and valid result.
-
What Results Files Do I Look At Exactly?
Valid question. In the folder “22_peak_processing,” open the “xxxx_all_peaks_calculated.tsv” file in excel and you’re good to go. Now to open it there is a little step to do…
Open a new blank workbook in excel
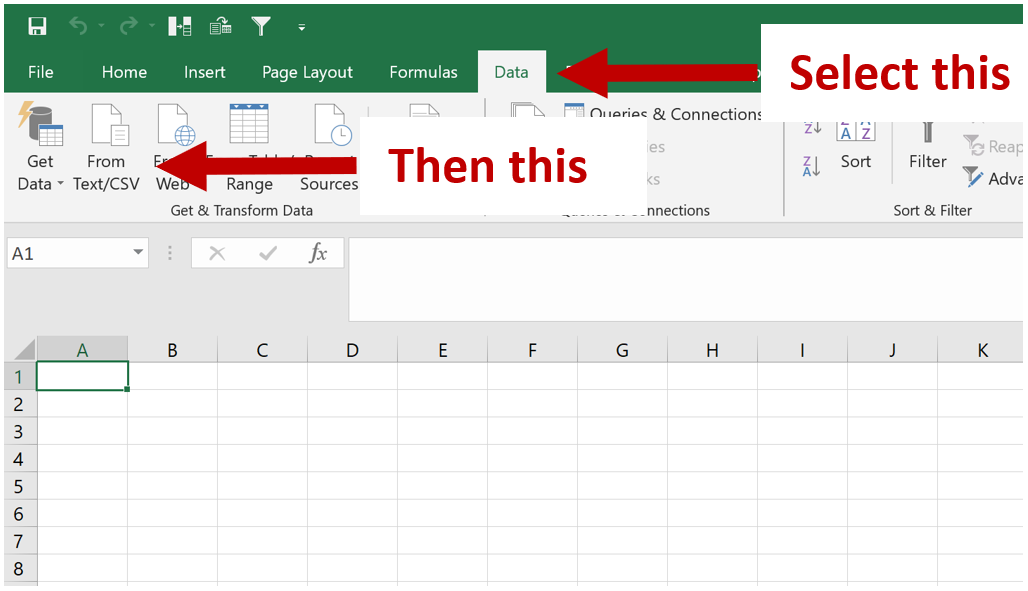
From this file, you can view all the results and data for you analysis. Refer to Interpreting ChIP-AP Output for the definition of what each column means.
-
How Do I View My Alignments And Data?
People typically want to view their results on UCSC or other genome browsers. As we don’t have a web-server to host such coverage files (and making an accessible ucsc hub is a real pain and we don’t want to implement that), the onus is on you to view them locally on your machine. All laptops, whether then can run ChIP-AP or not can run IGV and view the coverage and bam files. The coverage and bam failes can be located in the “08_results” folder.
Download IGV, install it (super easy) and then load the coverage and bam files needed. Make sure you load the right genome build however! That’s critical. From the ChIP-AP main output file (see the Main Pipeline Output section), you can copy columns B,C,D straight into IGV and it will take you to the peak region.
-
In Short, What's Relevant?
Easy answers-
Check fingerprint plot and make sure it looks good
-
Check venn.txt file and make sure you get good spread of peaks Together points 1 and 2 tell you your experiment worked!
-
Your final peak file is in “22_peak_processing” open the “xxxx_all_peaks_calculated.tsv” – This is the file you need to upload to GEO as your processed data file for your analysis and the only file you need to work with when looking through your data.
-
Also as part of your submission to GEO or as a supplemental table in your manuscript, you MUST include the settings table named “default_settings_table.txt” located in the root analysis directory. This provided with the raw fq files, which must be uploaded to GEO, will ensure complete reproducibility of the analysis performed.
-
Manuscript details for M&M. A statement such as the following should suffice:
For processing our ChIP-Seq analysis, we utilized ChIP-AP (https://academic.oup.com/bib/advance-article/doi/10.1093/bib/bbab537/6489109). Raw fq files are uploaded to GEO with accession number GSE172355, and the custom settings table utilized for analysis can be found on GEO as a processed settings file and also in supplemental table XX in our manuscript. Full details of ChIP-AP and its function can be found in its corresponding manuscript (https://academic.oup.com/bib/advance-article/doi/10.1093/bib/bbab537/6489109).
-
We have a Q&A section located as a wiki page with frequently asked questions and answers. This list will be updated as we receive more questions to advise the wider community.