Plot a pretty confusion matrix (like Matlab) in python using seaborn and matplotlib
Created on Mon Jun 25 14:17:37 2018 @author: Wagner Cipriano - wagnerbhbr
This module get a pretty print confusion matrix from a NumPy matrix or from 2 NumPy arrays (y_test and predictions).
pip install pretty-confusion-matrixExamples:
import numpy as np
import pandas as pd
from pretty_confusion_matrix import pp_matrix

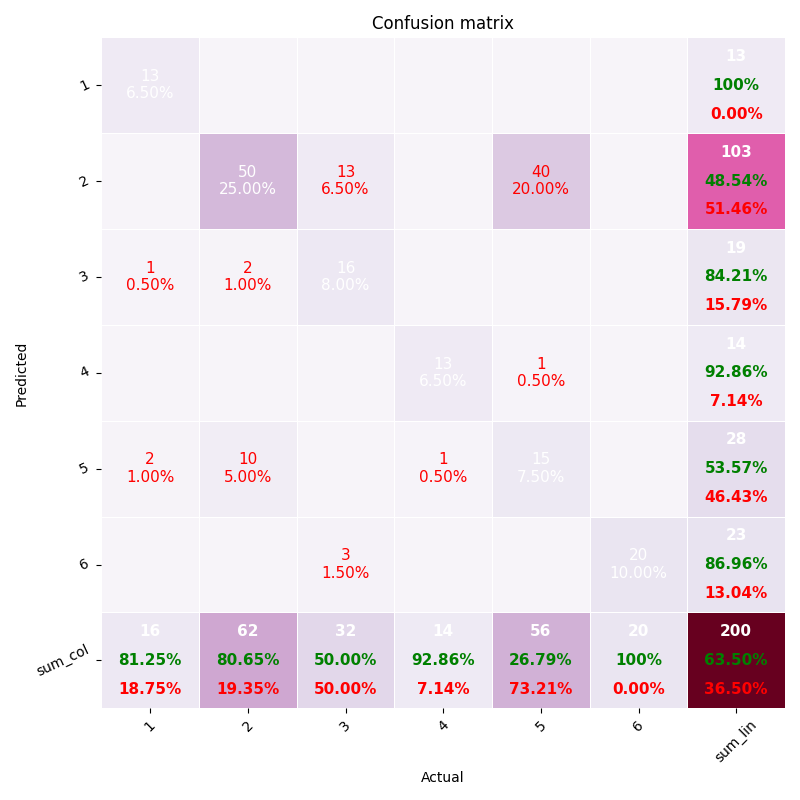
array = np.array([[13,  0,  1,  0,  2,  0],
                  [0, 50,  2,  0, 10,  0],
                  [0, 13, 16,  0,  0,  3],
                  [0,  0,  0, 13,  1,  0],
                  [0, 40,  0,  1, 15,  0],
                  [0,  0,  0,  0,  0, 20]])

# get pandas dataframe
df_cm = pd.DataFrame(array, index=range(1, 7), columns=range(1, 7))
# colormap: see this and choose your more dear
cmap = 'PuRd'
pp_matrix(df_cm, cmap=cmap)
import numpy as np
from pretty_confusion_matrix import pp_matrix_from_data
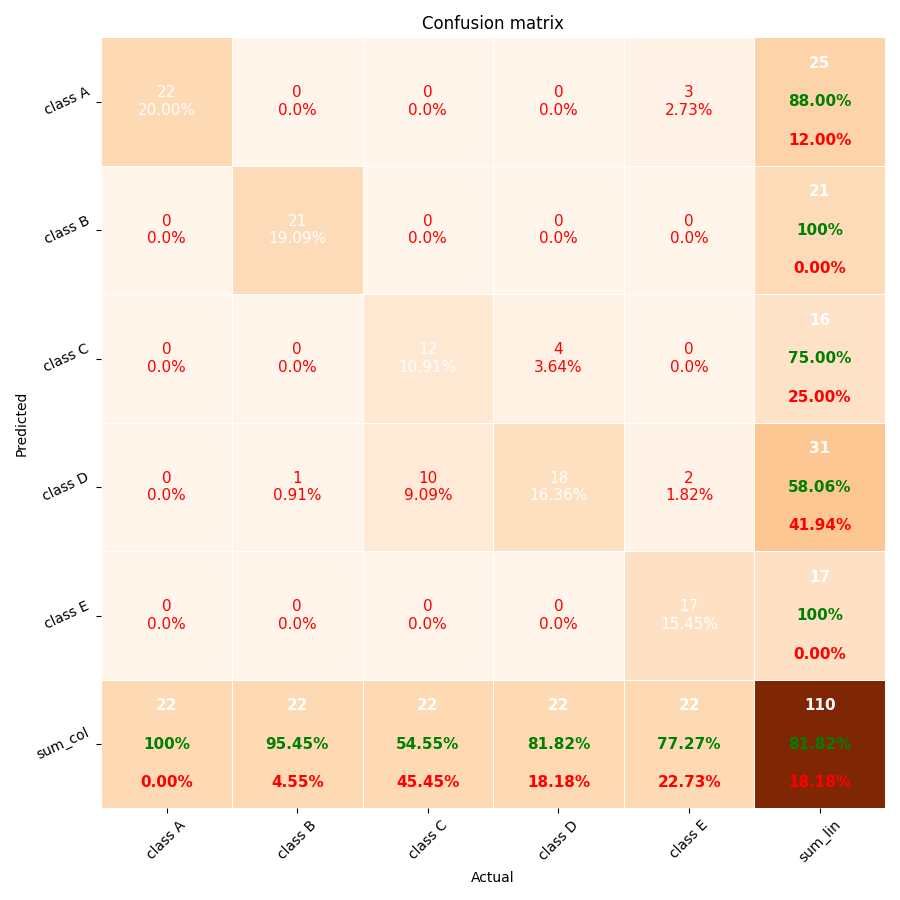
y_test = np.array([1, 2, 3, 4, 5, 1, 2, 3, 4, 5, 1, 2, 3, 4, 5, 1, 2, 3, 4, 5, 1, 2, 3, 4, 5, 1, 2, 3, 4, 5, 1, 2, 3, 4, 5, 1, 2, 3, 4, 5, 1, 2, 3, 4, 5, 1, 2, 3, 4, 5, 1, 2,
3, 4, 5, 1, 2, 3, 4, 5, 1, 2, 3, 4, 5, 1, 2, 3, 4, 5, 1, 2, 3, 4, 5, 1, 2, 3, 4, 5, 1, 2, 3, 4, 5, 1, 2, 3, 4, 5, 1, 2, 3, 4, 5, 1, 2, 3, 4, 5, 1, 2, 3, 4, 5, 1, 2, 3, 4, 5])
predic = np.array([1, 2, 4, 3, 5, 1, 2, 4, 3, 5, 1, 2, 3, 4, 4, 1, 4, 3, 4, 5, 1, 2, 4, 4, 5, 1, 2, 4, 4, 5, 1, 2, 4, 4, 5, 1, 2, 4, 4, 5, 1, 2, 3, 3, 5, 1, 2, 3, 3, 5, 1, 2,
3, 4, 4, 1, 2, 3, 4, 1, 1, 2, 3, 4, 1, 1, 2, 3, 4, 1, 1, 2, 4, 4, 5, 1, 2, 4, 4, 5, 1, 2, 4, 4, 5, 1, 2, 4, 4, 5, 1, 2, 3, 4, 5, 1, 2, 3, 4, 5, 1, 2, 3, 4, 5, 1, 2, 3, 4, 5])
pp_matrix_from_data(y_test, predic)- MATLAB confusion matrix:
b)Plot Confusion Matrix Using Categorical Labels
- Examples and more on Python:
a) How to plot confusion matrix with string axis rather than integer in python
b) Plot-scikit-learn-classification-report
c) Plot-confusion-matrix-with-string-axis-rather-than-integer-in-Python

