Table of Contents
SuperGreenCloud
Collection of pre-configured softwares to run the SuperGreenOS's cloud.
Features
- Everything in a
docker-compose.ymlfor easy deployement - MQTT sink port to receive all logs from the driver
- Minimal log post-processor to redirect to:
- Redis: stores all last values of each keys sent through the logs
- Promethes: stores all numeric values as timeseries for monitoring and alerts
- Elasticsearch (COMMENTED OUT): indexation and data analysis engine, indexes all logs for further analysis, haven't used it yet.
- Prometheus' alertManager: Allows to describe alert conditions from prometheus timeseries. Then produces alerts on various bias, slack, sms, pigeon, whatnot..
- cAdvisor/node-exporter: The server running the cloud's own monitoring.
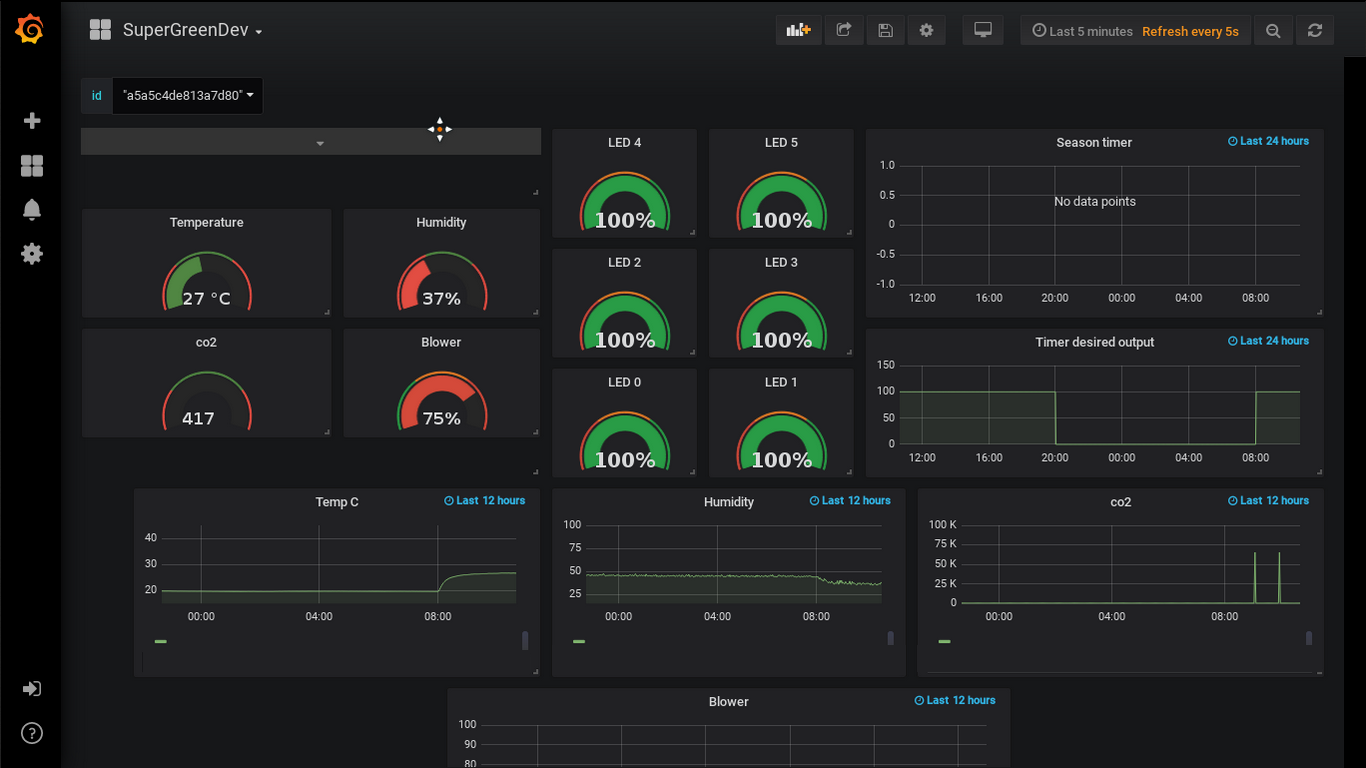
- Grafana: Produce nice graphs and dashboard from Prometheus timeseries.
- Kibana (COMMENTED OUT): Produce nice graphs and dashboard from Elasticsearch timeseries.
- Update http server for Over-The-Air (OTA) updates for the SuperGreenOS.
TODO
- Better way to upload the new builds' firmware update files
Quickstart
Only requirement in a working docker installation:
Configuration
There's not much to configure:
- mqtt login/pass: search for
mqtt_usernameandmqtt_passwordin docker-compose. - domain names used: search for
VIRTUAL_HOSTin docker-compose - http access passwords in
nginx/htpasswd/
Installation
Now that docker is installed and running, clone this repo, and from the repo's directory run the command docker-compose up
git clone git@github.com:supergreenlab/SuperGreenCloud.git
cd SuperGreenCloud
docker-compose up
When ran locally you might want to have the ports of each services accessible directly, just uncomment the ports sections in docker-compose.yml.
Attach firmware
In your firmware intance, set the BROKER_URL value through the http API to point to your installation, be sure to have configured the wifi access.
Should be somehting like mqtt://sink.supergreenlab.com:1883. (If running locally, use your IP address, whatever the domain you set in docker-compose.yml)
Restart the firmware.
View logs remotely
The first thing we can do is view the MQTT broker's logs coming inside our log post-processor:
docker attach --no-stdin --sig-proxy=false supergreencloud_mqttparser_1
You can safely Ctrl+C to exit that.
If nothing happens there might be something wrong, directly viewing the firmware's logs through usb will give hints.
Graphs, Dashboards and monitoring
At that point we have:
firmware -> MQTT -> post-processor -> Prometheus
So we're ready to view our data as graphs.
Just point to the URL you specified in your docker-compose.yml with your browser, if you left the default, you'll have grafana.supergreenlab.com, DON'T FORGET TO ADD IT TO YOUR /etc/hosts OR THAT WON'T BE WHAT YOU THINK IT BE.
Default access are:
- login:
supergreen - password:
multipass
Now everthing should be setup for you to start their tutorial from this section.


