Analyses accompanying article on coelacanth evolution.
Prof Corey J. A. Bradshaw
Global Ecology | Partuyarta Ngadluku Wardli Kuu, Flinders University, Adelaide, Australia
June 2023
e-mail
article:
CLEMENT, AM, R CLOUTIER, MSY LEE, B KING, O VANHAESEBROUCKE, CJA BRADSHAW, H DUTEL, K TRINAJSTIC, JA LONG. 2024. A Late Devonian coelacanth reconfigures actinistian phylogeny, disparity, and evolutionary dynamics. Nature Communications 15: 7529. doi:10.1038/s41467-024-51238-4
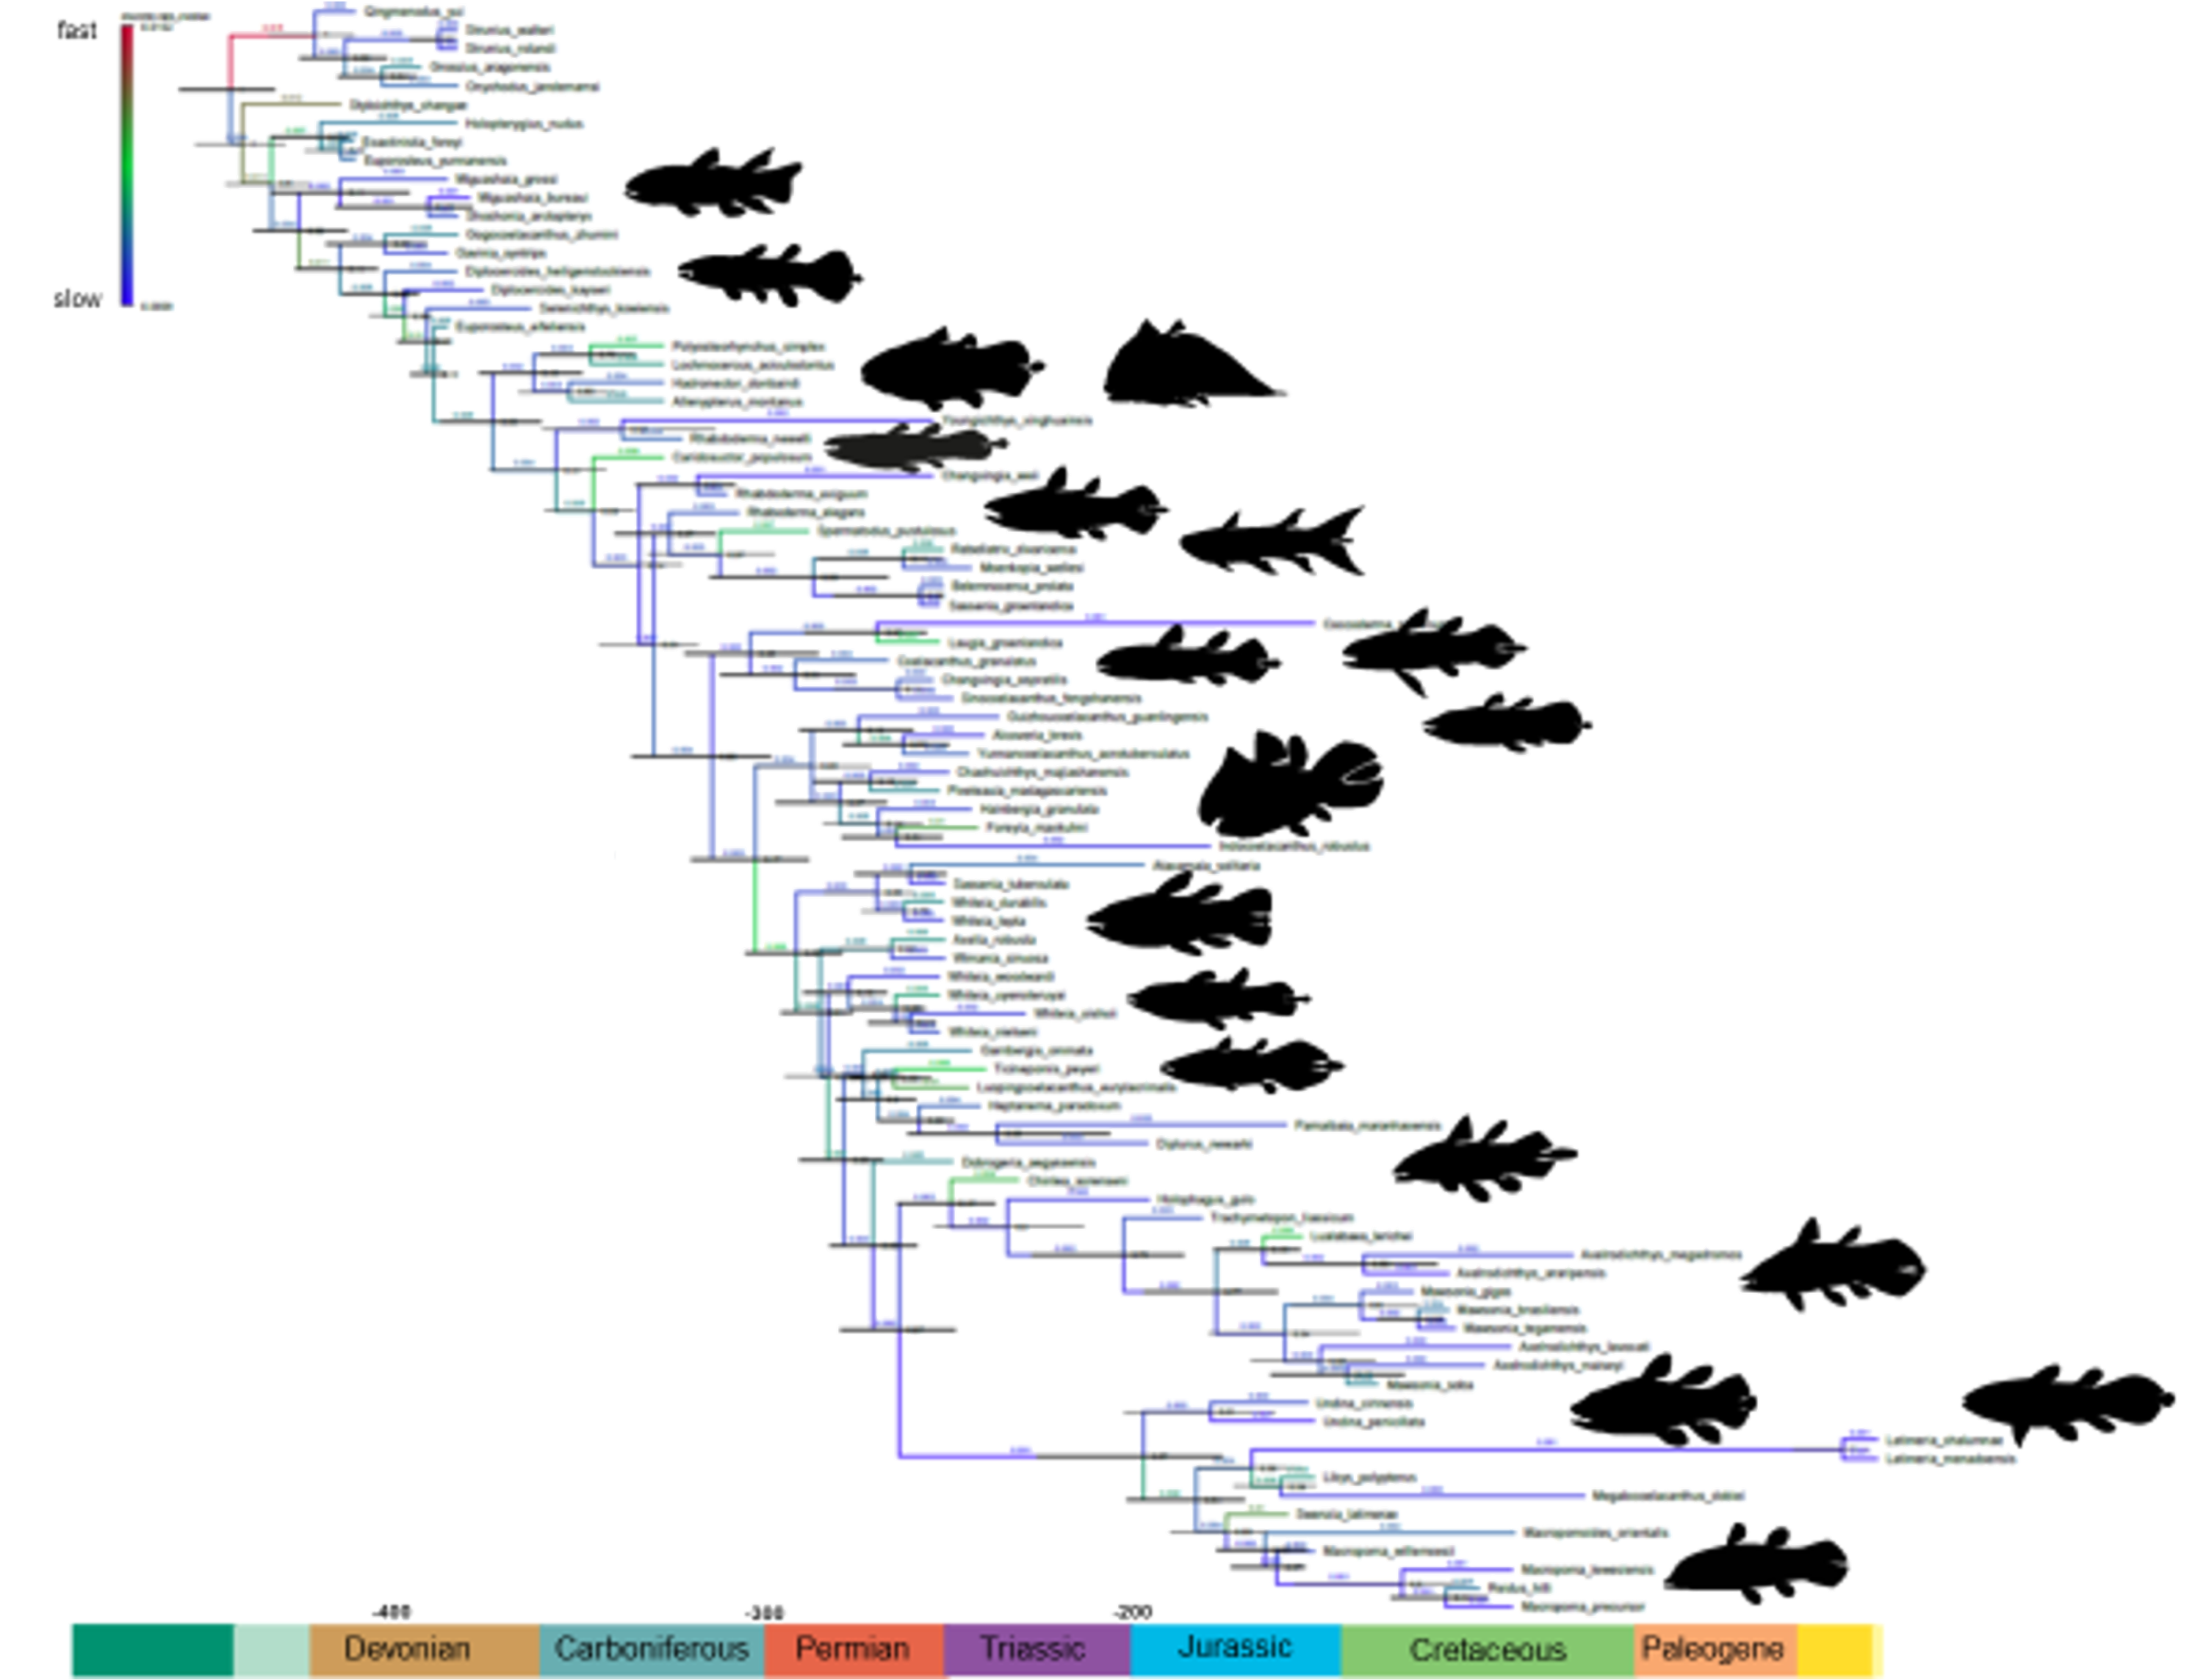
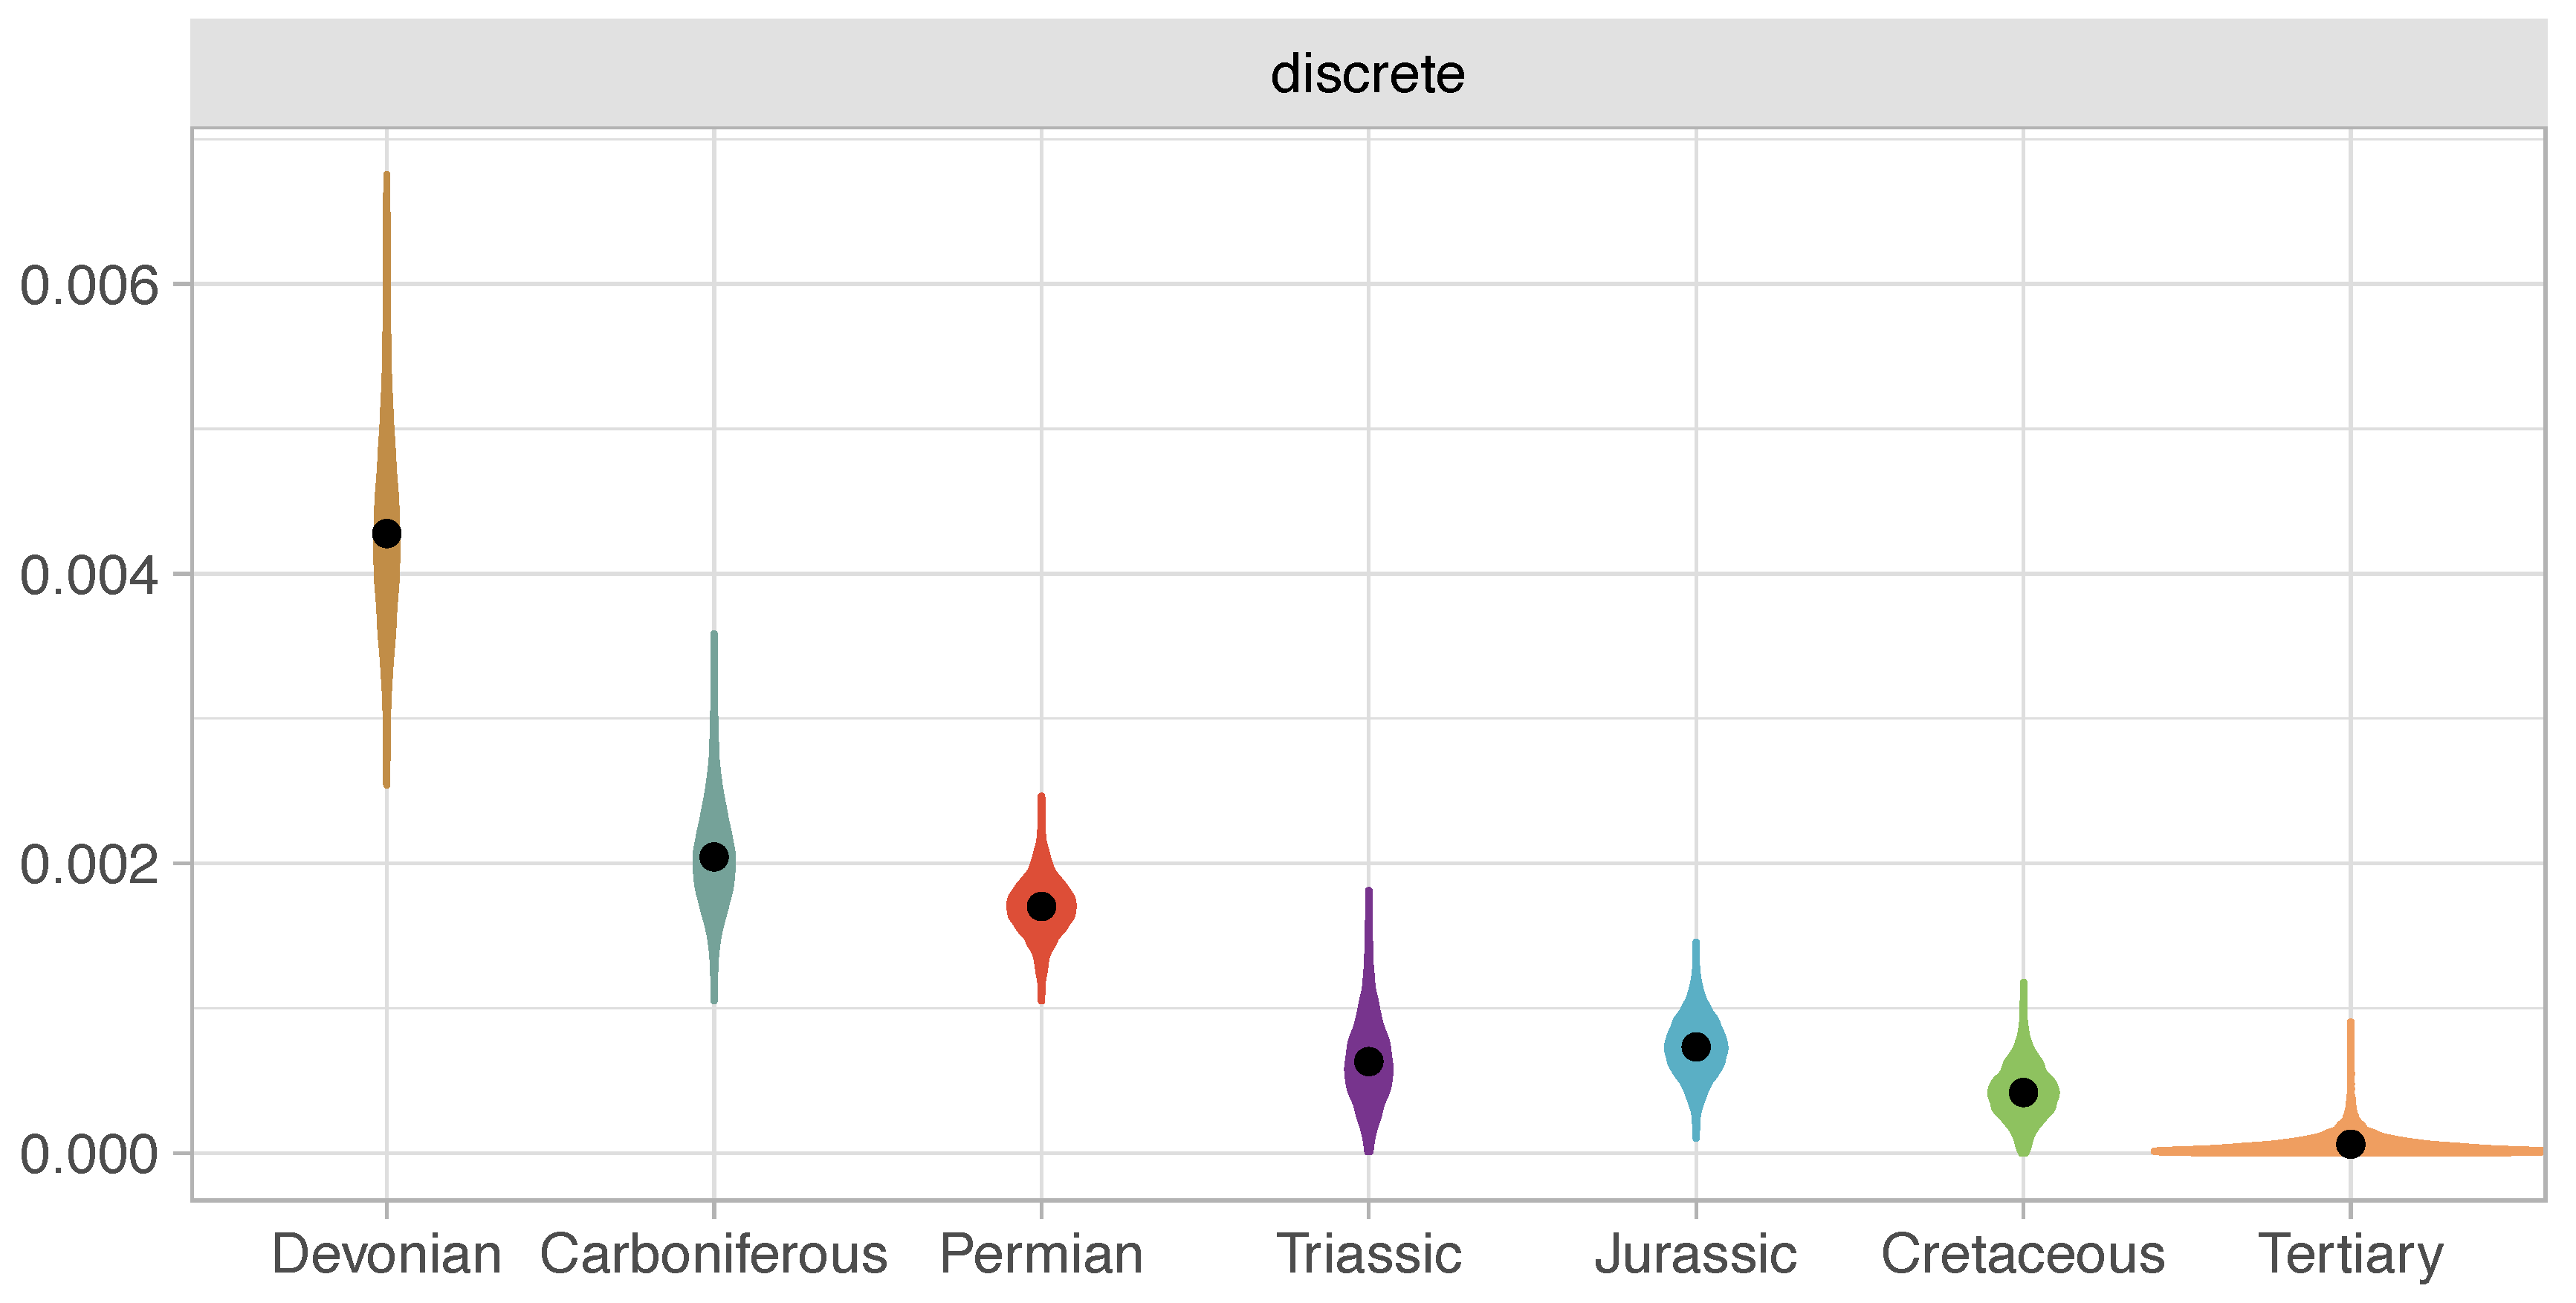
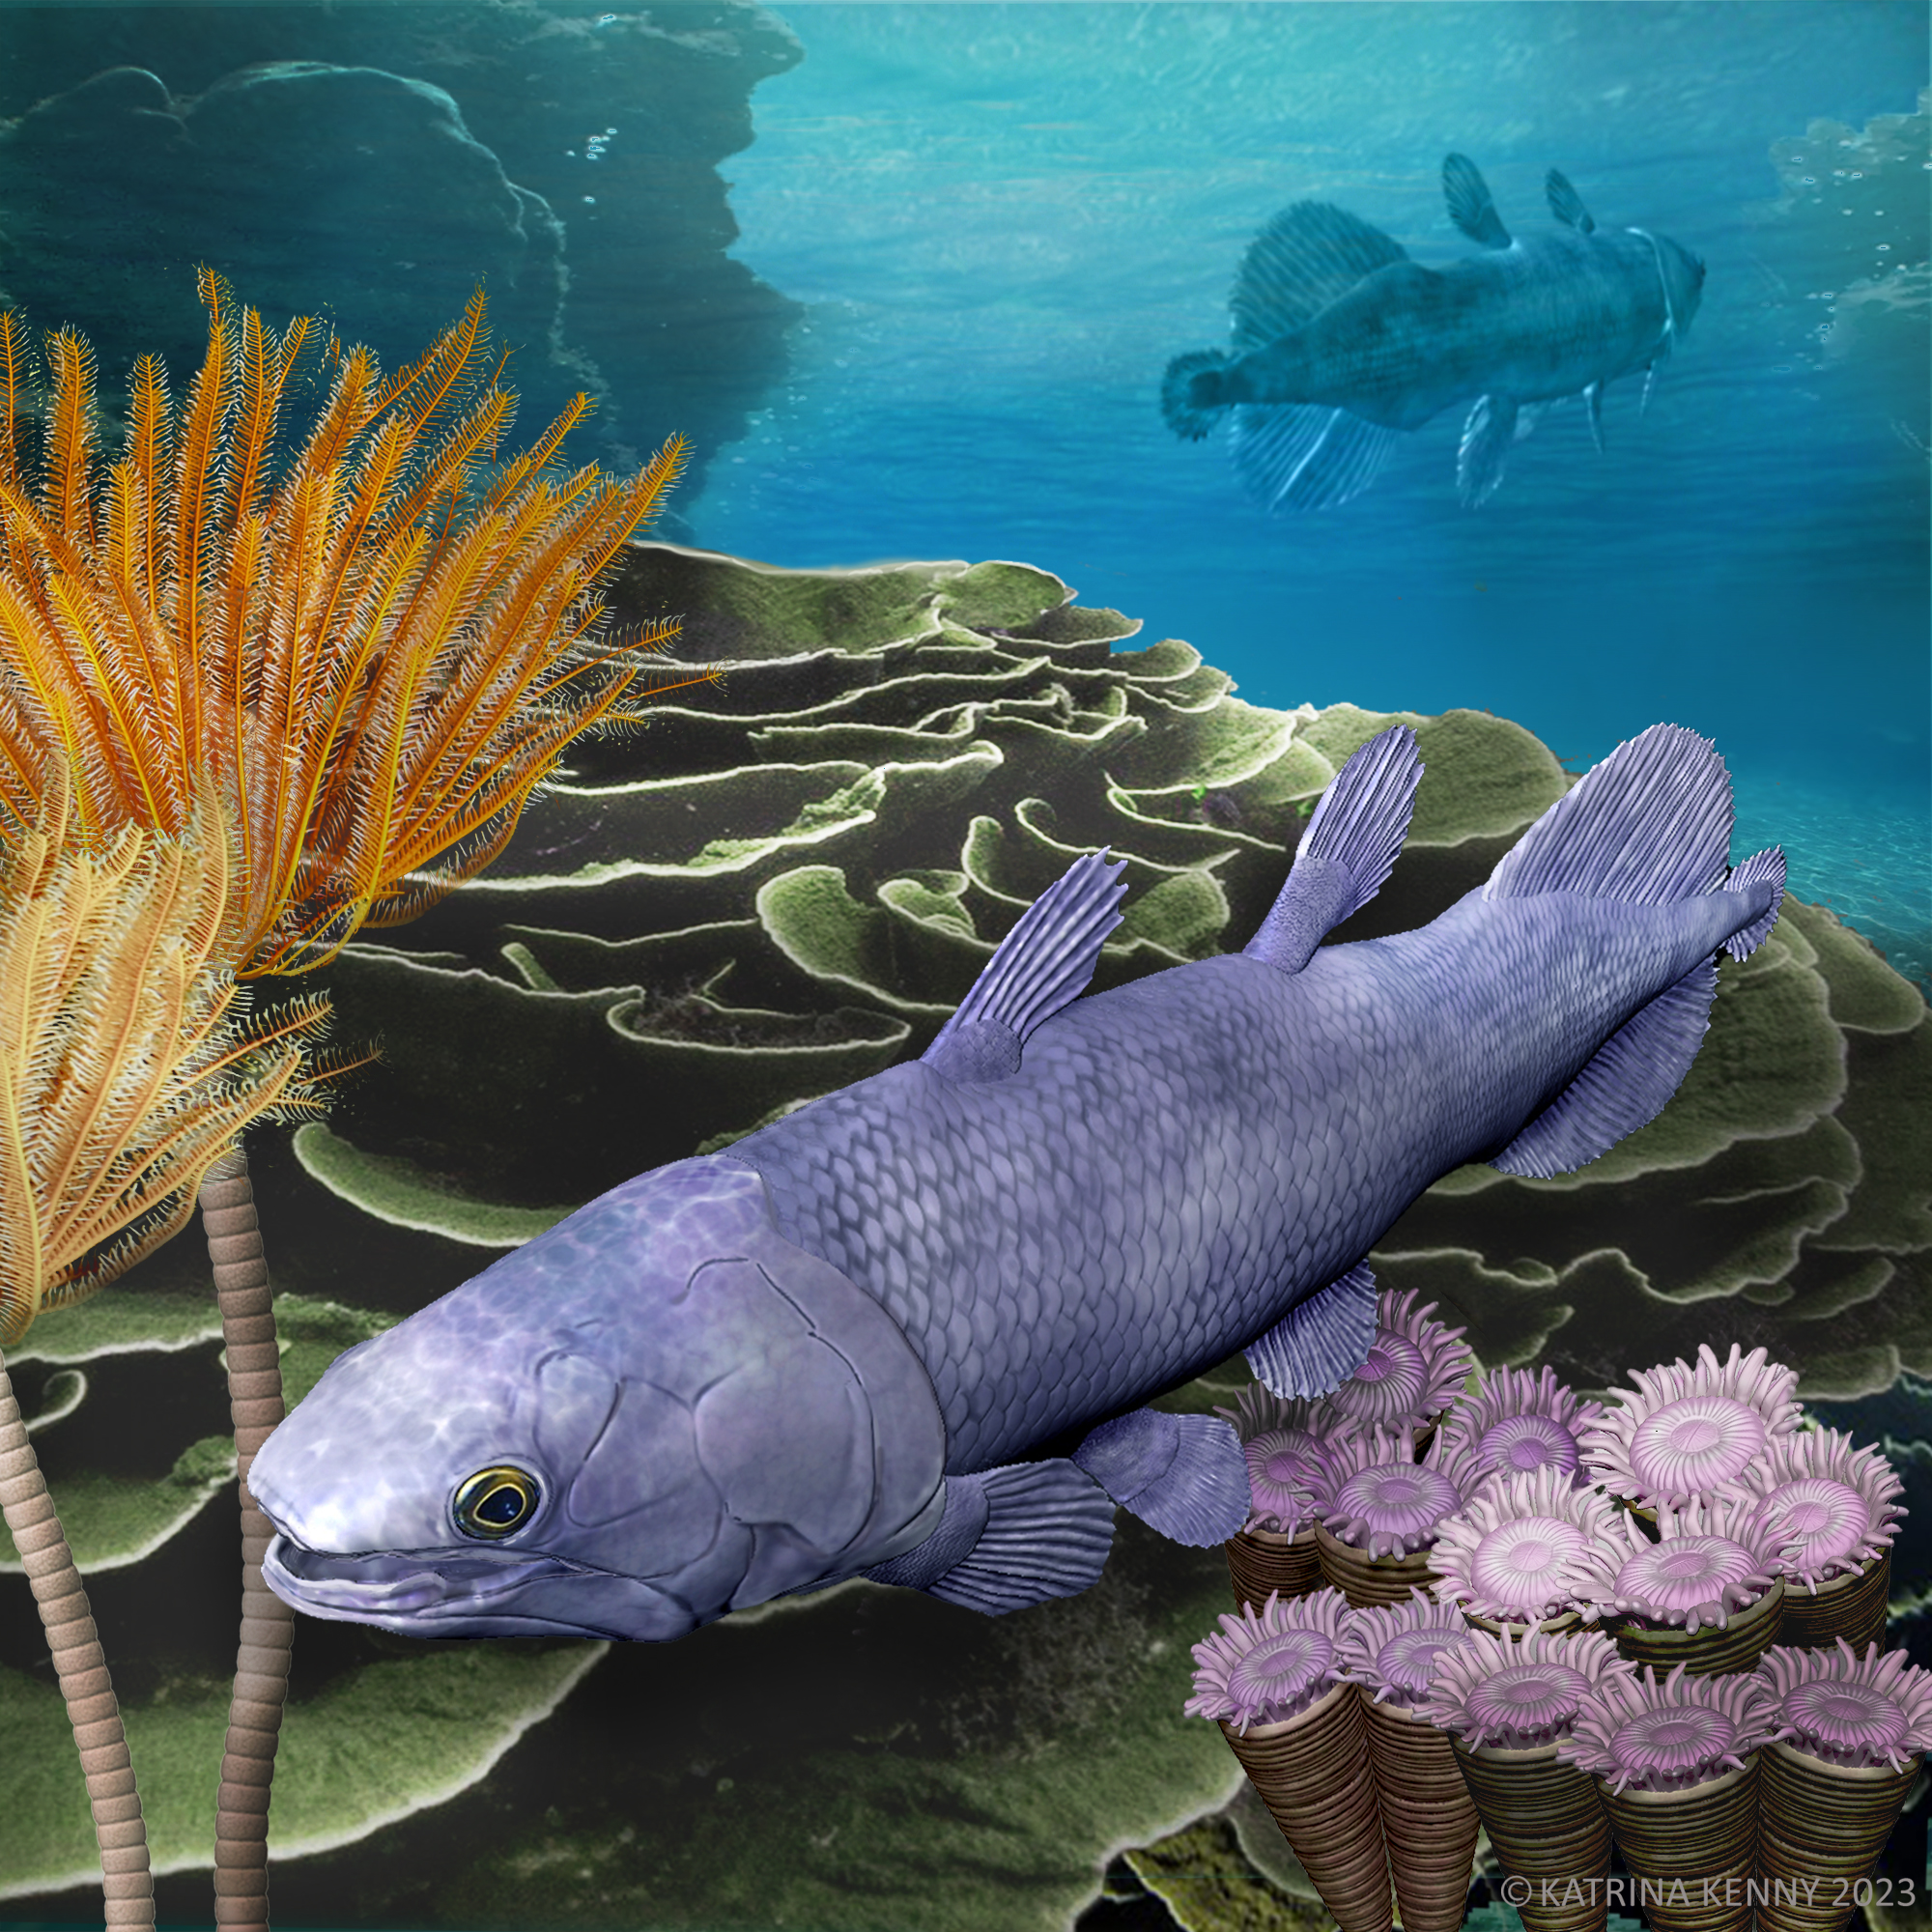
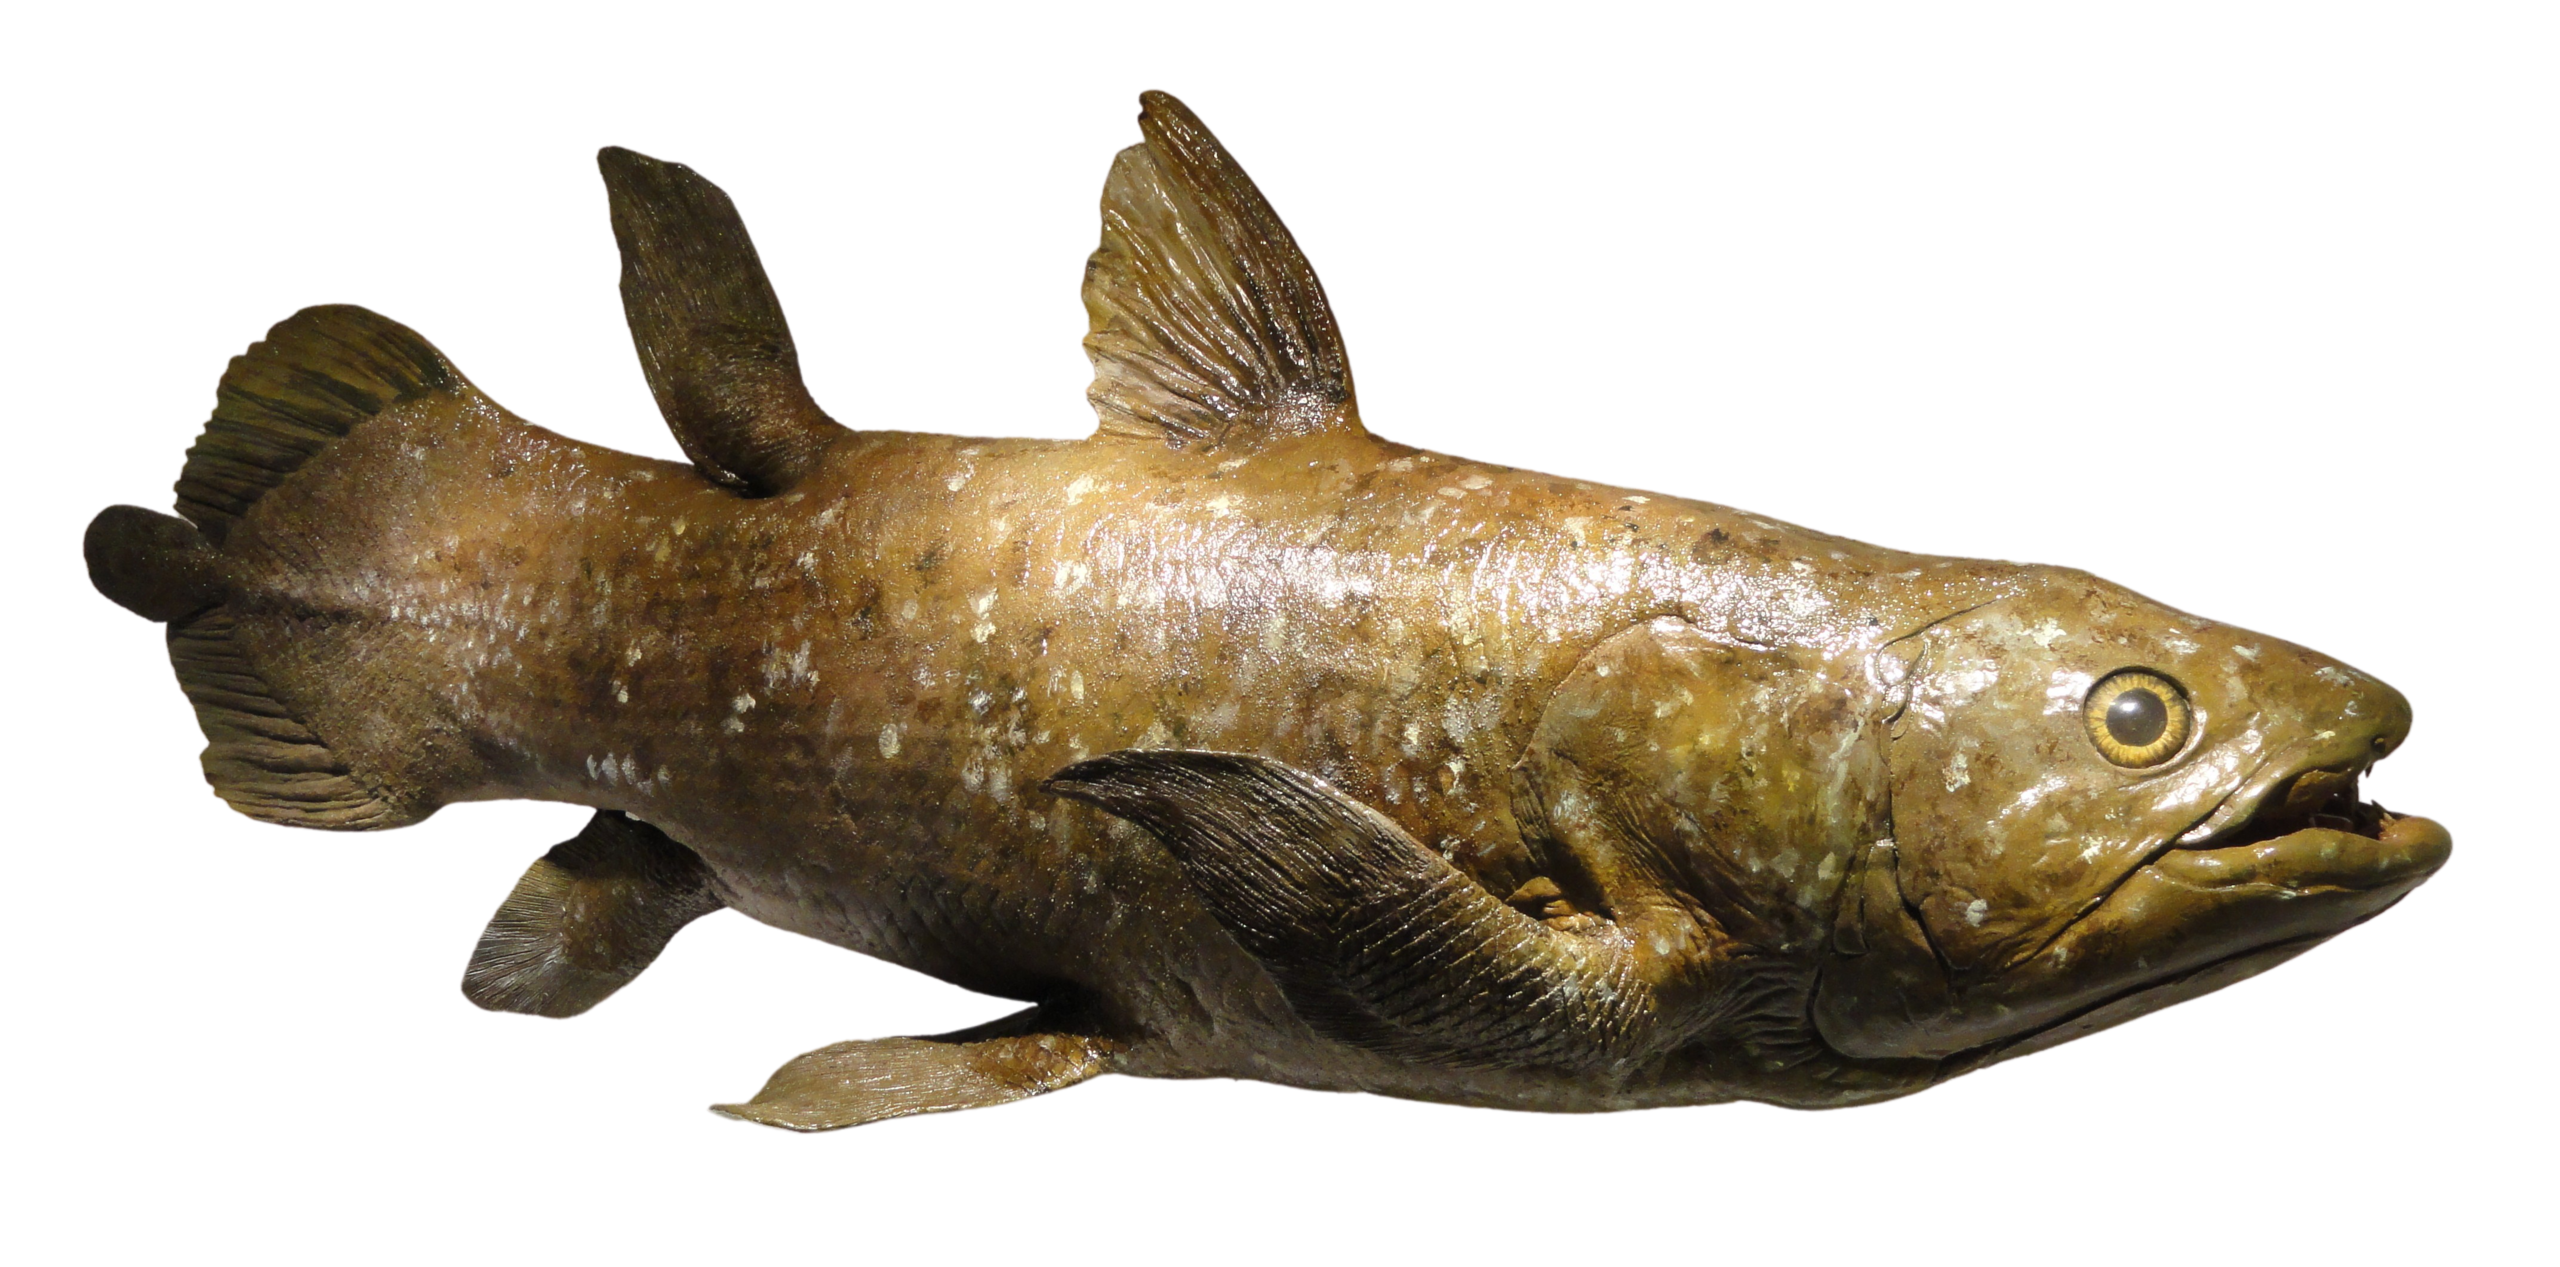
The living coelacanth Latimeria (Sarcopterygii: Actinistia) is an iconic so-called ‘living fossil’ within one of the most morphologically conservative vertebrate groups. We describe a new, exceptionally preserved 3-D coelacanth from the Late Devonian Gogo Formation in Western Australia. We assembled the most comprehensive analysis of the group to assess the phylogeny, evolutionary rates, and morphological disparity of all coelacanths. The new fossil fish fills a critical transitional stage in coelacanth disparity and evolution. We revealed a major shift in morphological disparity between Devonian and post-Devonian coelacanths. Since the mid-Cretaceous, discrete character changes (representing major morphological innovations) have essentially ceased, while meristic and continuous characters have continued to evolve within coelacanths. Considering a range of putative environmental drivers, tectonic activity best explains variation in the rates of coelacanth evolution.
BEAST(Bayesian phylogenetic analysis of discrete, meristic and continuous traits; written by Mike Lee)TNT(parsimony analysis of discrete, meristic and continuous traits; written by Mike Lee)
rates_through_time.R(developed by Ben King): R code for plotting the uncorrelated log-normal (UCLN) clock rates through time requires BEAST time treefile (concatentated, post-burnin) for input. This file contains 8000 trees and is 2 GB, and might have to be subsampled (thinned) due to memory constraints to run the script; plots in article subsampled every 5th tree. Tree file included here (Coelacanths_87_268_tipsVariance_Dis_Mer_Con_uclnG_RootExp418_MC3_sumBi20/thinned.trees) is only the first 10 trees from this subsampled file (~ 2 MB).functions.R: R source functions called inrates_through_time.Repoch_clock.R: R code to create epoch_clock plot (below)
3. disparity
disparity.R (developed by Olivia Vanhaesebroucke): R code for disparity analyses and figure.
- Coelacanth evolR-envir model.R (developed by Corey Bradshaw): R code to reproduce the resampled boosted regression tree analysis for determining the environmental drivers of coelacanth rate of evolution.
- Morphobank (morphological matrices) Project 3471 (project leader: Alice Clement): project SSD files
- Postcranial.TPS, Jaws.TPS, Skull.TPS: TPS files with landmarks coordinates for the three morphological disparity analyses with geometric morphometrics
- Matrix_corrected.nex: Nexus file containing corrected matrix for morphological disparity analysis with discrete characters
- Age-habitat.xlsx, Age-habitat-Jaw.xlsx, Age-habitat-GM-PC.xlsx, Age-habitat-Skull.xlsx: Excel files with the list of species and their ages for disparity analyses (figures)
- coelacanthDatV2.csv (compiled by Richard Cloutier): rate of evolution and environmental data (continental flooding area1, subduction flux2, atmospheric [CO2]3, sea surface temperature5, dissolved [O2]4
1Marcilly et al. 2022 Gondwana Res 110:128;
2Marcilly et al. 2021 Gondwana Res 97:176;
3Witkowski et al. 2018 Sci Adv 4:3aat4556;
4Song et al. 2019 J Earth Sci 30:236
Required R libraries

cluster, data.table, dismo, dispRity, dplyr, gbm, geoscale, ggplot2, ggrepel, grid, Momocs, phylotate, phytools, plyr, readxl, reshape2, scales, stats, tidyverse, vegan
