In this project I am going to produce an easy to use, reliable and well designed python module that domain experts and data scientists can use to fetch, visualise, and transform publicly available satellite and LIDAR data. In particular, the code will interface with USGS 3DEP and fetch data using their API.
- Introduction
- Installation
- Quickstart
- Notebooks
- Scripts
- utils
- tests
- data
- laz
- tif
- 3D
- pipeline.json
- regions.txt
- Install
- Quickstart
I work at an AgriTech, which has a mix of domain experts, data scientists, data engineers. As part of the data engineering team, I have been tasked to produce an easy to use, reliable and well designed python module that domain experts and data scientists can use to fetch, visualise, and transform publicly available satellite and LIDAR data. In particular,the code will interface with USGS 3DEP and fetch data using their API.
You can clone this python package to your local machine by running the following command
$ git clone https://github.com/deadex-ng/usgs_lidar_package.gitThis code has been built into a python package but has not been built into a python libray yet.
This code creates a custom pdal pipeline. The paratemeters of the pipeline can be modified by editing main.py.
boundaries = bounds.set_bounds(-93.756155, 41.918015, -93.747334, 41.921429)

#check if region exists
flag = region.check_region_exists('IA_FullState')

#set region
region_url = region.set_region('IA_FullState')

#set output file
output_file = file_handler_obj.set_output_file_name('iowa')

#read pdal pipeline
json_file = open('../pipeline.json')
data = json.load(json_file)

#edit json file
data['pipeline'][0]['bounds']=boundaries
data['pipeline'][0]['filename']=region_url
data['pipeline'][6]['filename']=output_file[0]
data['pipeline'][7]['filename']=output_file[1]
with open('../pipeline.json', 'w') as f:
    f.write(json.dumps(data))


pipeline_path = '../pipeline.json'
#run pdal pipeline in python
PDALPipeline.run_pipeline(pipeline_path)
Once the pipeline has been executed,we have the .las and .tif file.We can extract data from these files.From a .las file,we can extract x,y and z and visualize the data.
The data visualization code is here
The plot below shows the height distribution of different points.
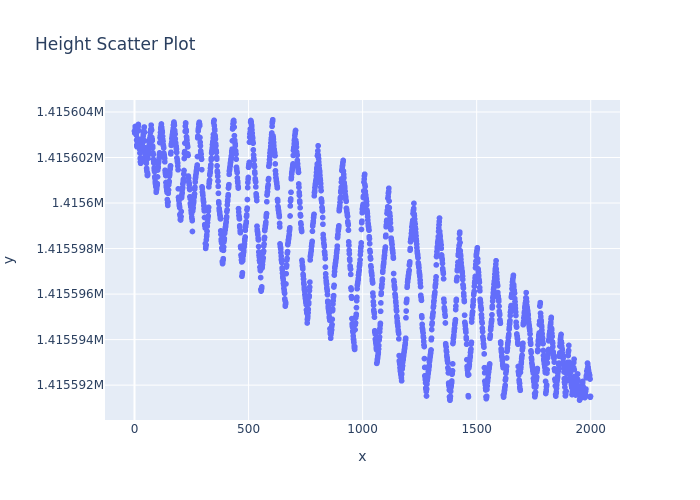
We can also genearate a 3D of the terrain from the extacted data.This picture shows how a 3D terrain looks like.The actual 3D is here

vizualization.ipynb: Notebook file showing extracted data from las file, Geopandas dataframe with extracted data, Height Scatter Plot, IDW Function, Interpolation Points and 3D render of the TerrainvisualizeTif.ipynb: Notebook file showing a visual map of a tif file.get_data.ipynb: Notebook file showing how to get 3DEP data using py3dep and visualizing the data using mtplotlib.
main.py: This is the script where the parameters(boundaries,region and output file) for the pipeline are set.
file_handler.py: This is has the class used to set the output file name.get_bounds.py: This is has the class used to set the boundaries.get_region.py: This is has the class that is used to set region.
test_file_handler.py: This is used to testfile_handler.pytest_get_bounds.py: This is used to testget_bounds.py
- Contains csv files that store coordinates
- Contains .las/.laz files
- Contains .tif files
- Contains 3D images of the terrain
- This is the pipeline that fetches data from USGS,preprocess it and stores it in both .las and .tif file
- This file contains all the regions available in USGS