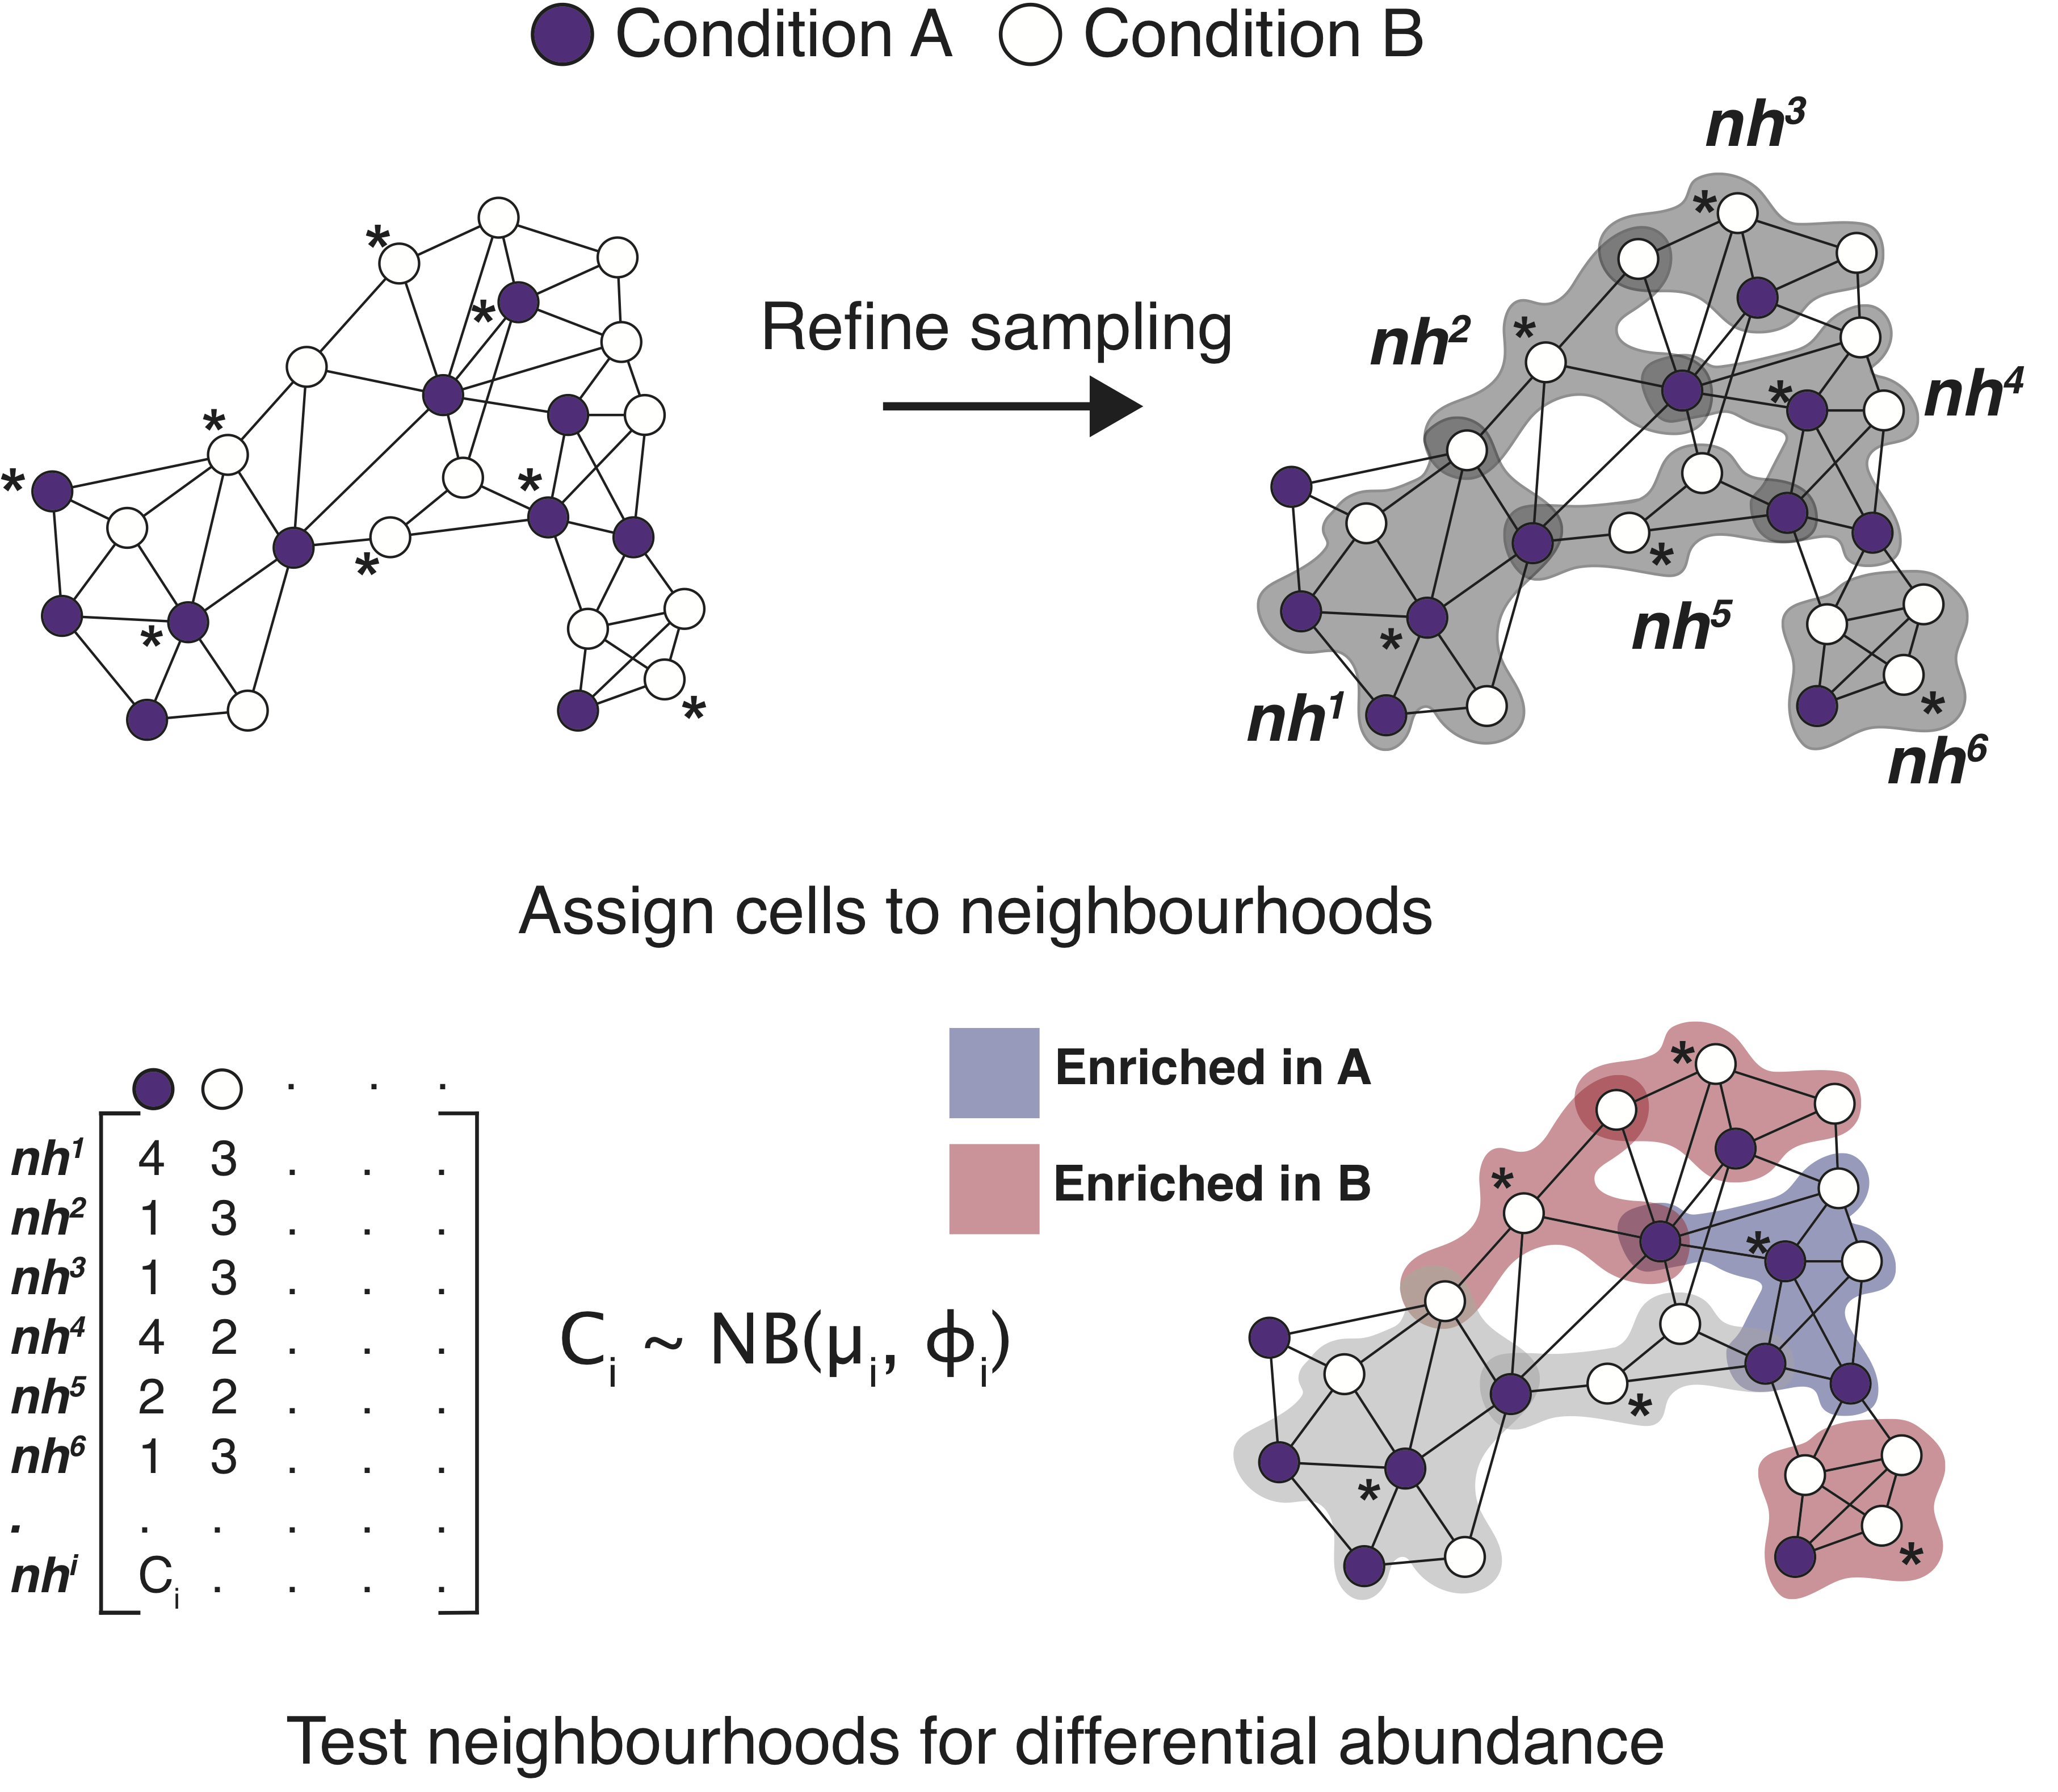
Milo is a method for differential abundance analysis on KNN graph from single-cell datasets.
## Install development version
devtools::install_github("MarioniLab/miloR")
- Basic Milo example on simulated dataset
- Milo example on mouse gastrulation dataset: this includes a demo for downstream analysis functions.
- Integrating Milo in scanpy/anndata workflow
The vignettes and the reference manual can be browsed at https://marionilab.github.io/miloR/.
An example of the Milo work flow to get started:
data(sim_trajectory)
milo.meta <- sim_trajectory$meta
milo.obj <- Milo(sim_trajectory$SCE)
milo.obj
Build a graph and neighbourhoods.
milo.obj <- buildGraph(milo.obj, k=20, d=30)
milo.obj <- makeNhoods(milo.obj, k=20, d=30, refined=TRUE, prop=0.2)
Calculate distances, count cells according to an experimental design and perform DA testing.
milo.obj <- calcNhoodDistances(milo.obj, d=30)
milo.obj <- countCells(milo.obj, samples="Sample", meta.data=milo.meta)

milo.design <- as.data.frame(xtabs(~ Condition + Sample, data=milo.meta))
milo.design <- milo.design[milo.design$Freq > 0, ]

milo.res <- testNhoods(milo.obj, design=~Condition, design.df=milo.design)
head(milo.res)
For any question, feature request or bug report please create a new issue in this repository.
