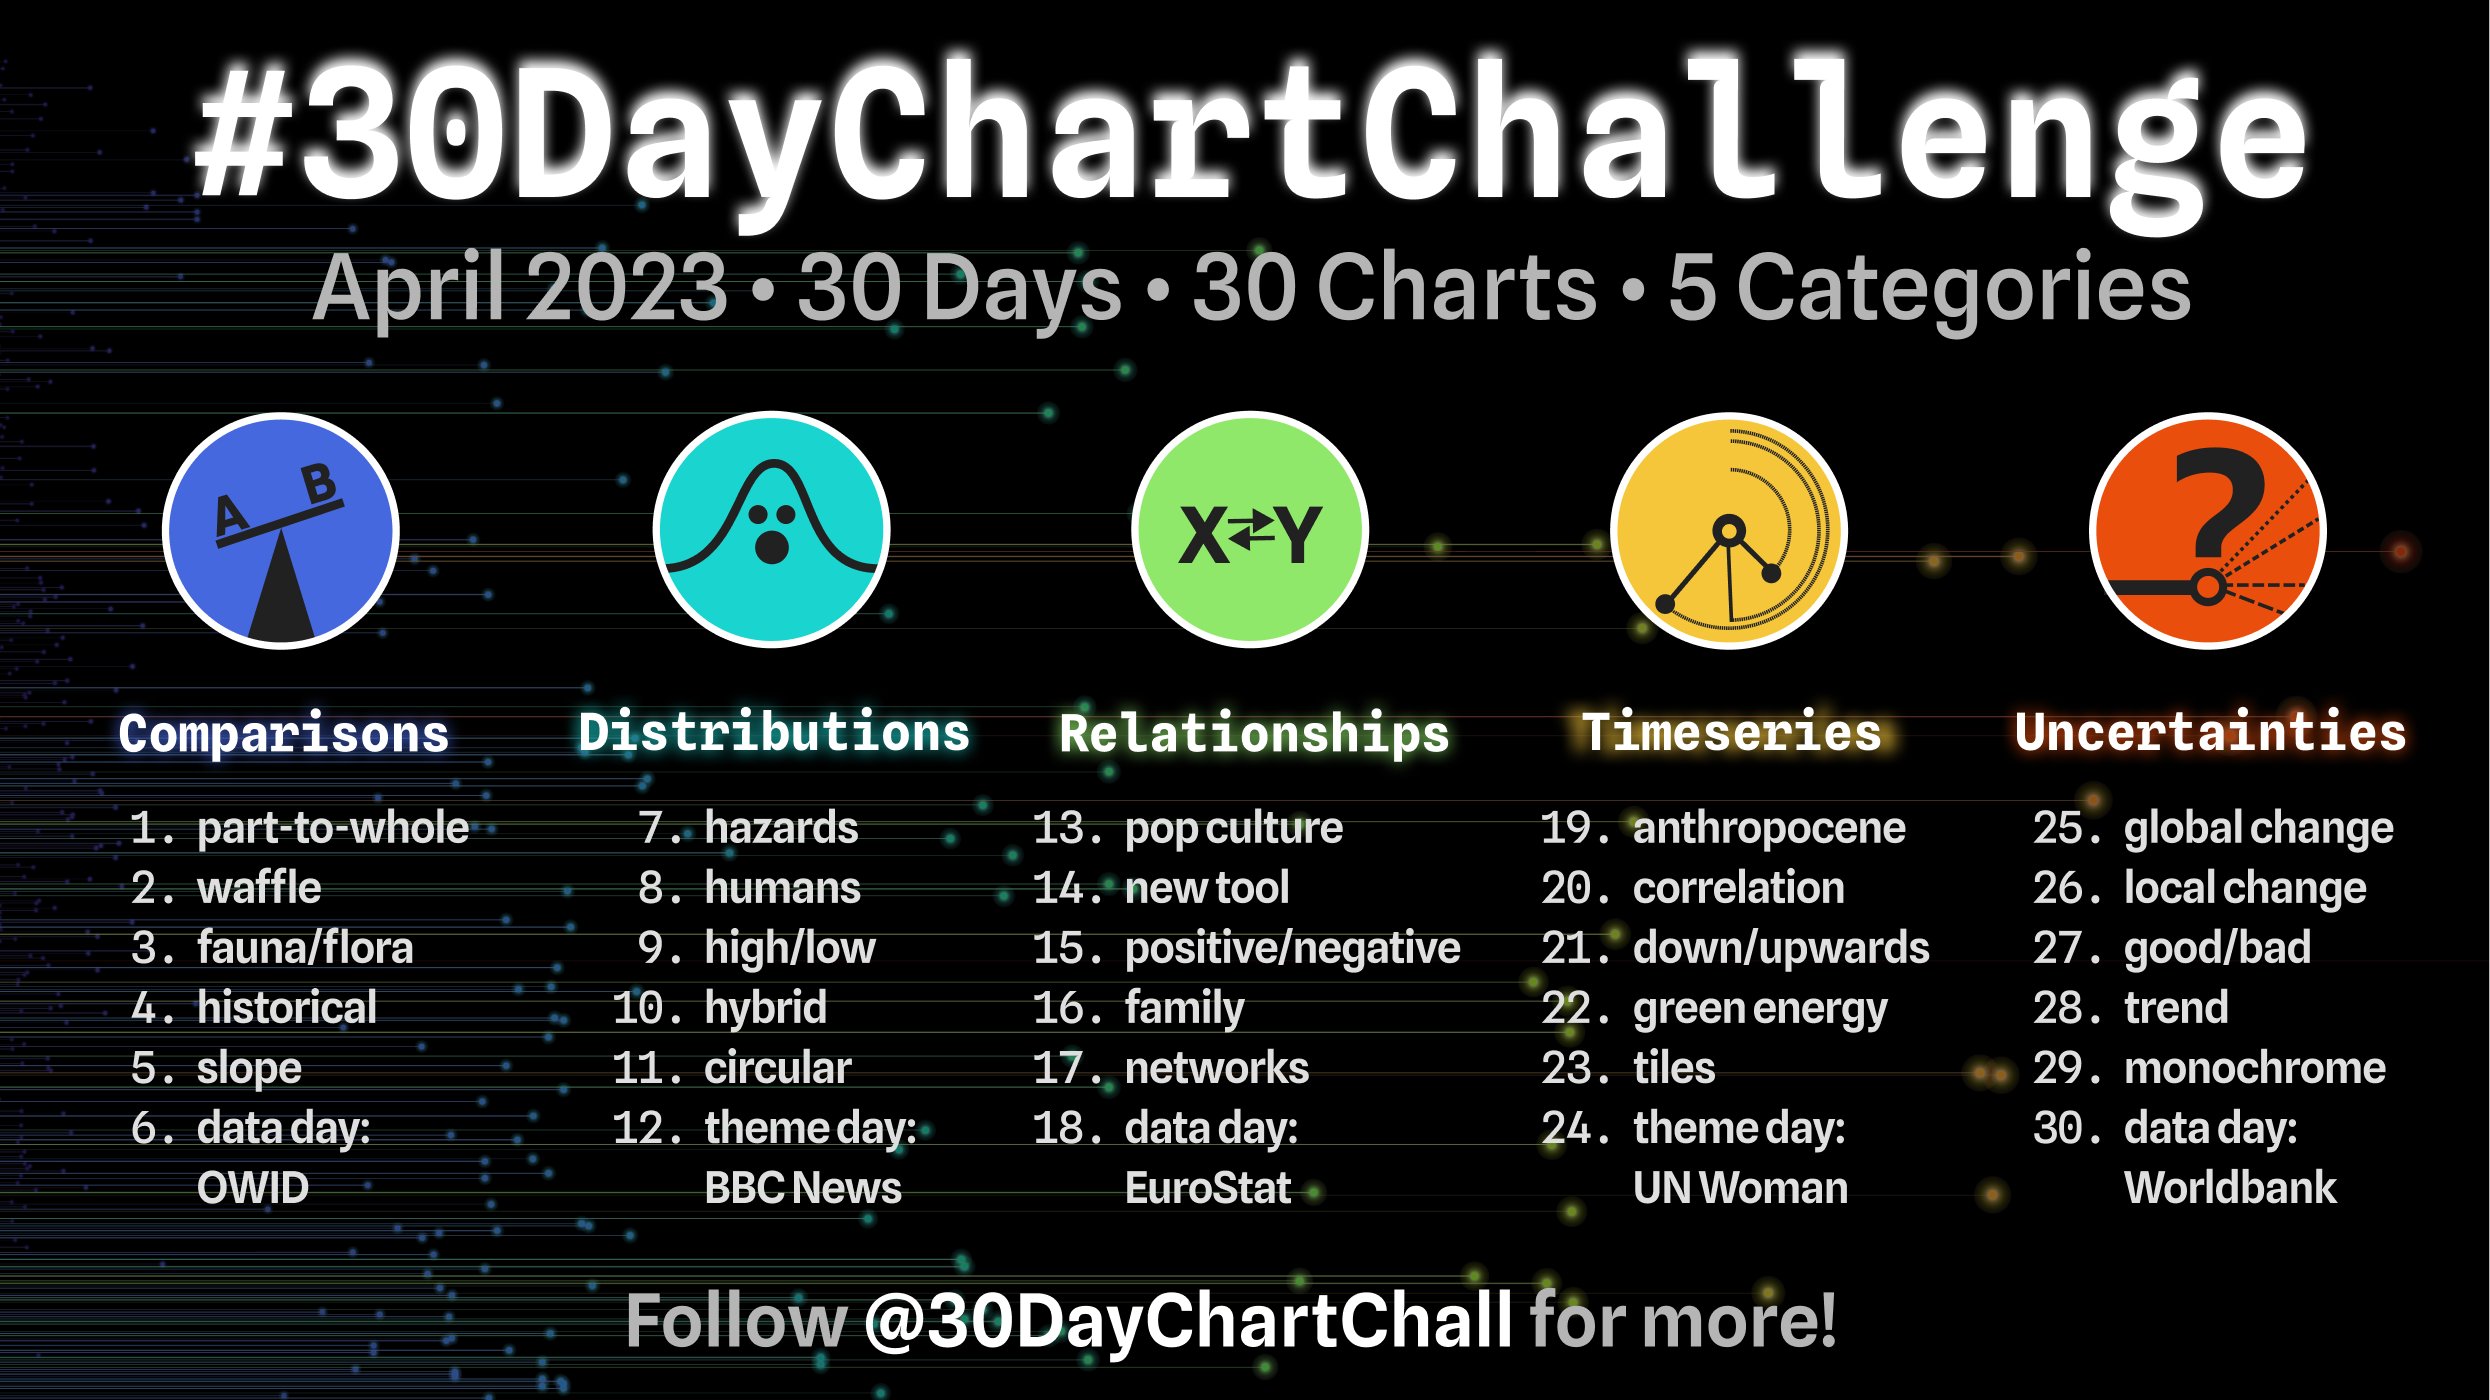
Learn more about #30DayChartChallenge:
ggplot2 visual using pictorial percentage chart (see part-to-whole)
- Code: Day01.R
- Packages used: tidyverse (ggplot2), sf, patchwork, ggtext
- Data sources:
- Wikipedia: Forest cover by state and territory in the United States; note: the official source is US Forest Service's Forest Inventory and Analysis.
- Census States Shapefile (2018)
- Unrelated, but check out rFIA
Resources that helped:
- Adapted mostly from SO: Pictorial percentage chart in R
- Coordinate reference system (crs) explainer
- plot_annotation (patchwork)
- SO: color in patchwork title
- SO: bold/emphasis in annotate function
ggplot2 waffle
- Code: Day02.R
- Packages used: tidyverse (ggplot2, plyr), rvest, janitor, patchwork, liamgilbey/ggwaffle
- Data sources: Wikipedia lists of single-movie box office gross revenues; ex. year of 1969
- Notes:
- Legend output has a bug I couldn't work around.
- Some months have 6 weeks (vs. usual 4-5 weeks) in length. This impacts the "ease" of looking at the visual.
- Color choice could use some work.
Resources that helped:


