Raghav Khanna
Lukas Schmid
Autonomous Systems Lab
ETH Zurich
- Fork or branch
- Please adhere to the following styleguide
- Send a PR and tag me
If you find this repository useful in your scientific work, please consider citing
A Spatio Temporal Spectral Dataset for Plant Stress Phenotyping by Khanna, Raghav and Schmidt, Lukas and Nieto, Juan and Siegwart, Roland and Liebisch, Frank
Some functionality depends on the following third party software
- Scripts are configured to be run from the root
plant_stress_phenotypingfolder by default.
| Filename | Folder | Description |
|---|---|---|
CMV2K-SSM5x5-600_875-5.5.9.2.xml |
spectral_image | Spectral response data for the Ximea camera, lens and filter setup used for the dataset |
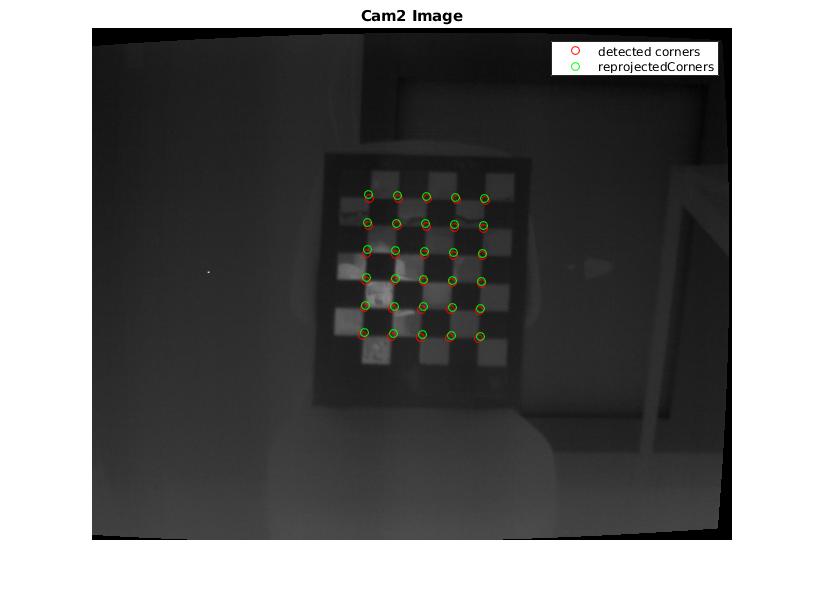
Folder 3dprocessing contains utility functions for intrinsic and extrinsic camera calibration, stereo reconstruction and reprojection used for creating the spatio-spectral point clouds.
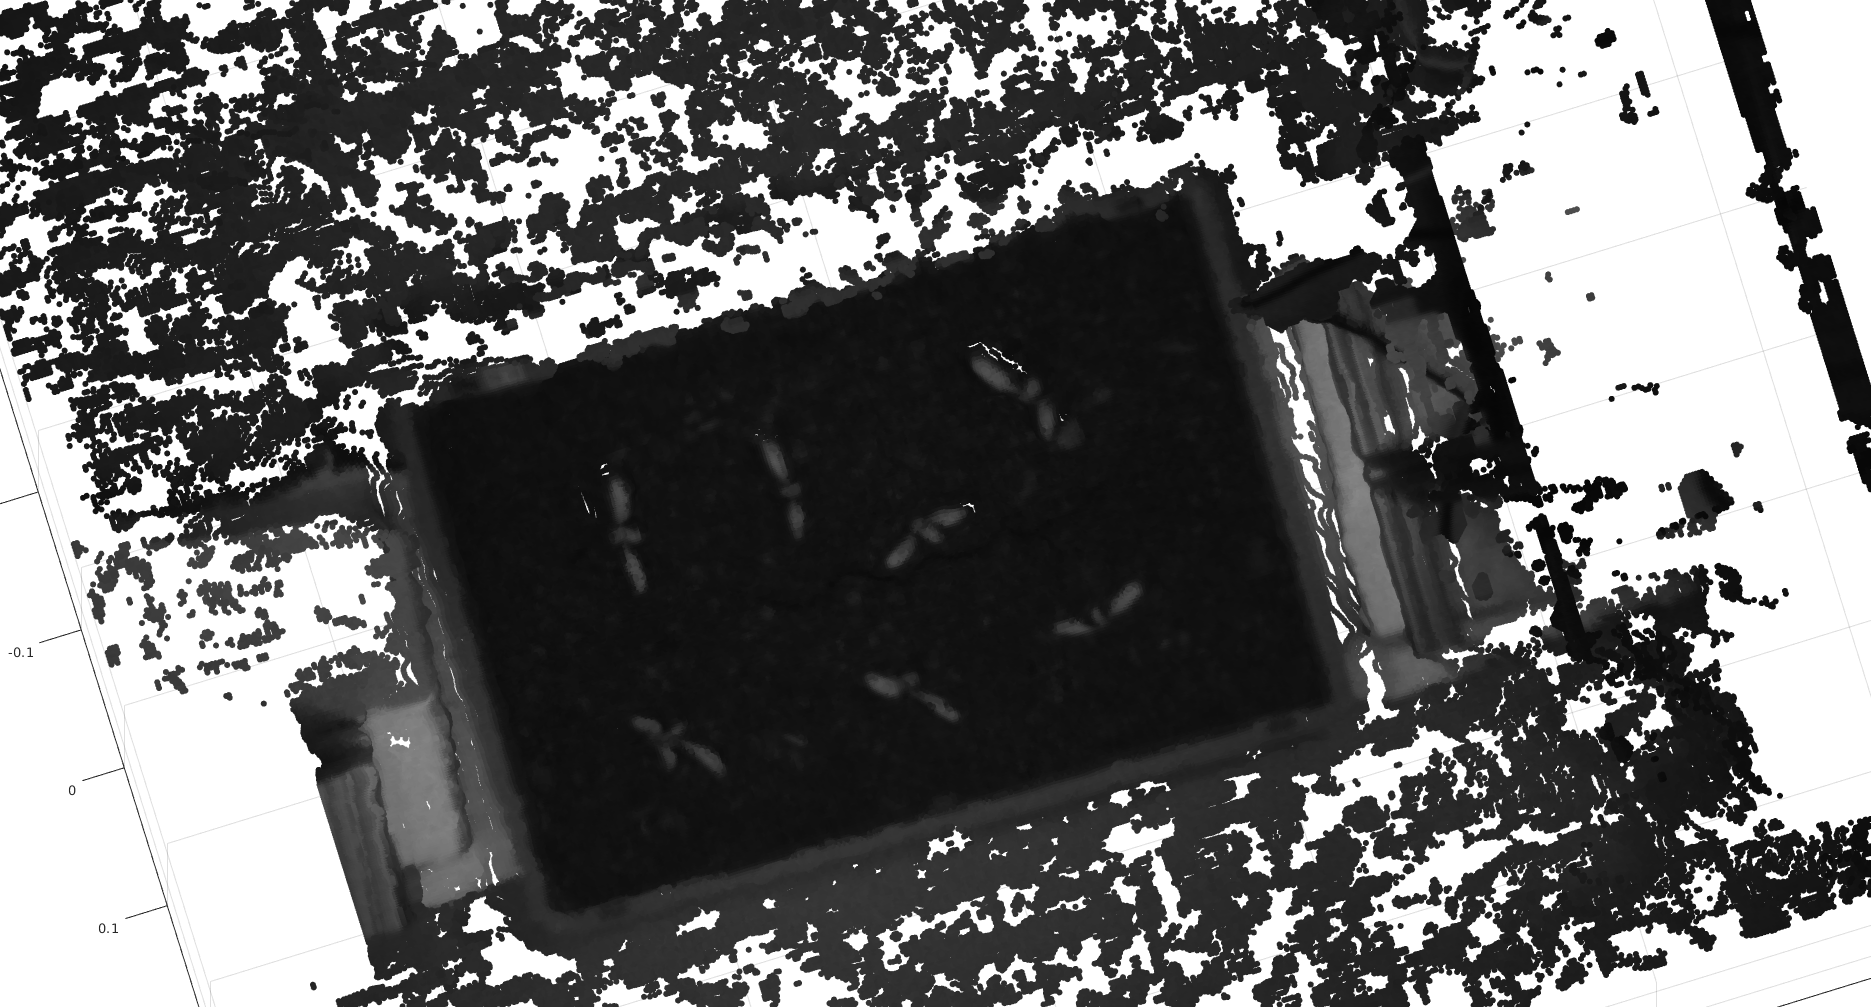
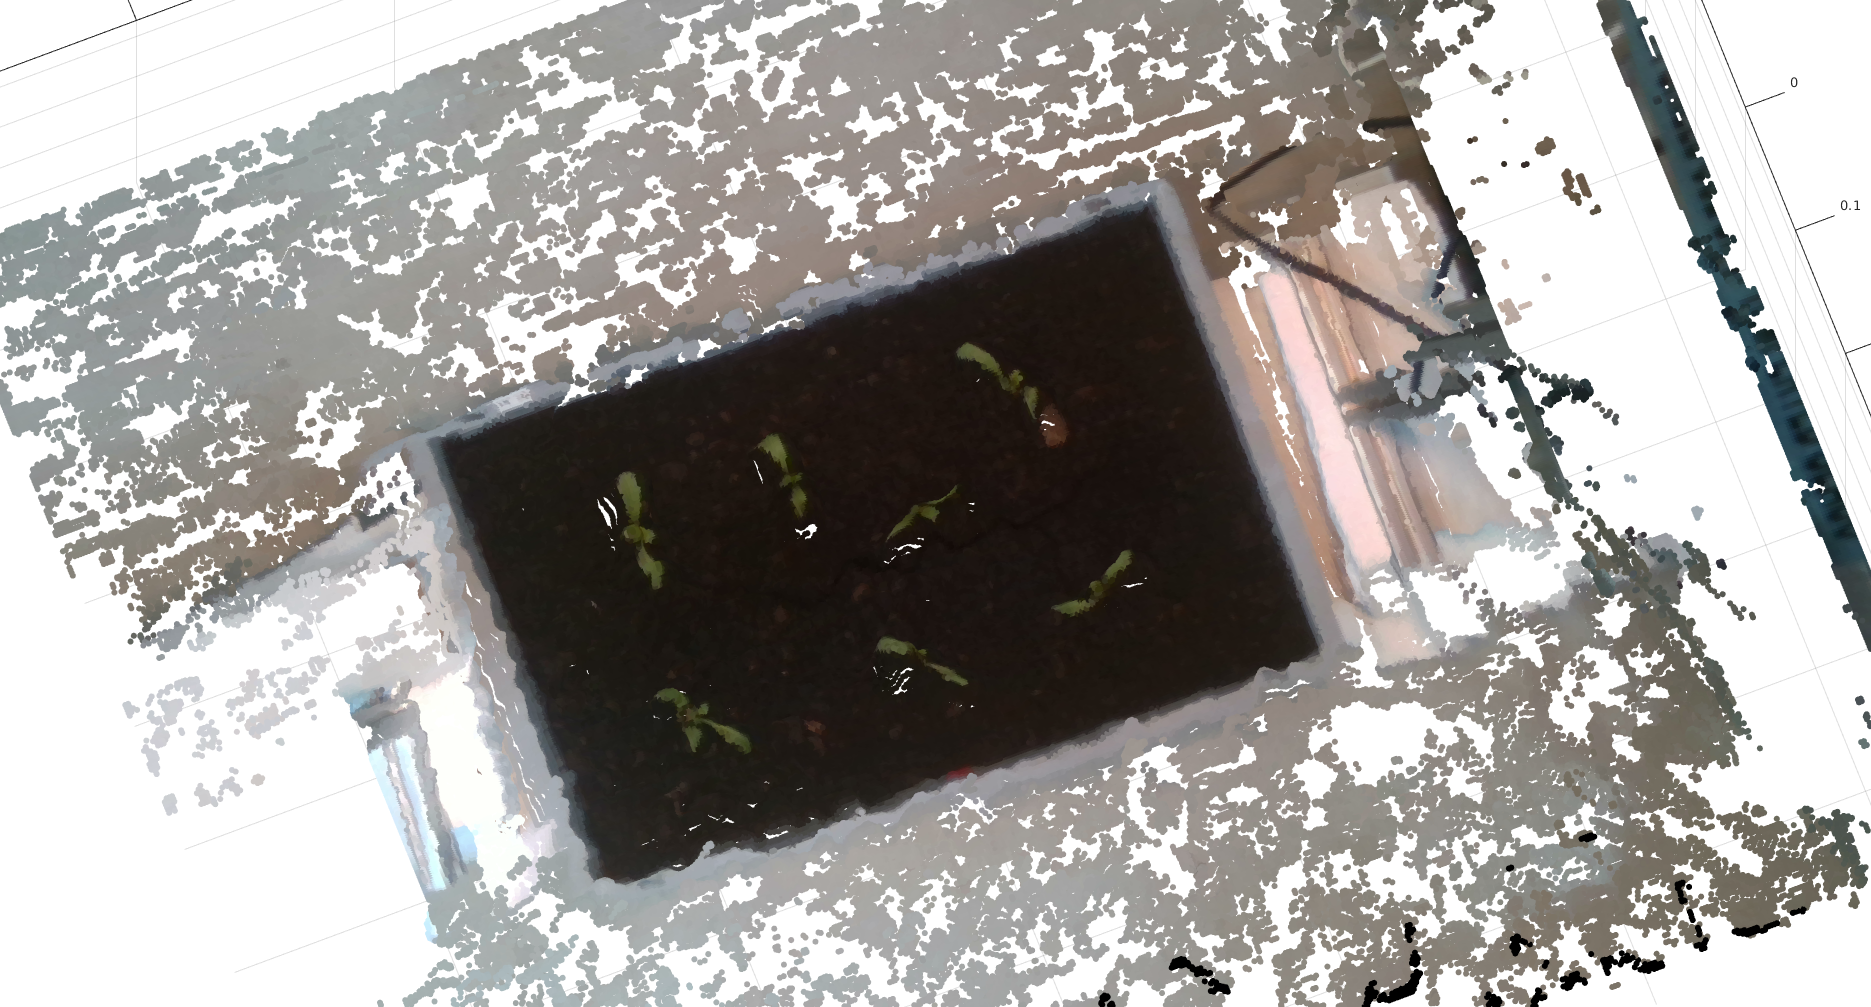
Folder data_evaluation contains routines to process raw images and create spatio-spectral point clouds for each box and at each timestep.
| Filename | Type | Description |
|---|---|---|
getimagesfromfolder.m |
function | Retrieves 31 images of given image type from the specified measurement date folder. |
cropboxfromimage.m |
function | Crops out a rectangular region from an image, corresponding to the plant box given its parameters |
computereflectancefactors.m |
function | Estimate the reflectance normalization factor for each measurement in a full measurement set of 31 boxes for a given timestep, using the standard reflectance panel attached to the camera setup. |
MeasurementPointCloud.m |
class | Spatio-spectral point cloud data structure. Class member functions may be used to construct point cloud objects, analyse and visualize its properties. |
script_detect_box_rgb.m |
script | Semi automated workflow to detect box extents from rgb images. The output box parameters may be used as input for cropboxfromimage.m. Our baseline box detections are available for the entire dataset (16 dates x 31 boxes in the boxDetections.mat file which can be found in the results folder.) |
script_create_measurementpointcloud.m |
script | Demo script to fully build and populate MeasurementPointCloud objects from raw images. |
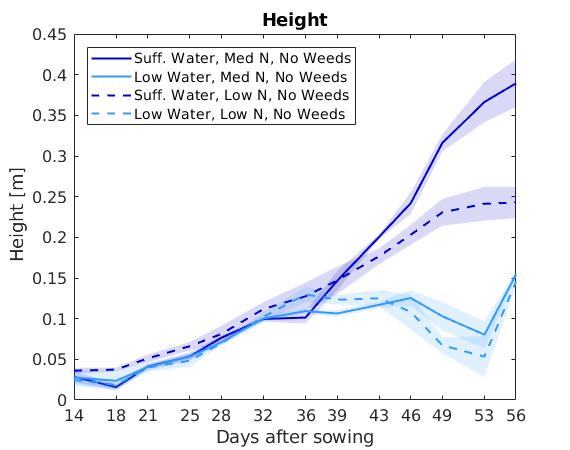
Folder indicator_analysis contains routines to extract, visualize, analyse and compare phenotypic indicators from the MeasurementPointCoud objects.
Folder models contains routines for learning plant growth models (as development of indicators over time) from IndicatorData and using these models to infer stress factor probabilities given a novel set of the indicators.
| Filename | Type | Description |
|---|---|---|
script_supervised_learning.m |
script | Can be used to train a variety of supported classifiers for plant stress severity level prediction. |
ClassifierMethods.m |
class | Defines the different supported classifier types |
getClassifierModel.m |
function | Returns the requested type of classifier model from MATLAB's Statistics and Machine Learning toolbox given its ClassifierMethods type. |
perCauseAccuracy.m |
function | Returns the % accuracy of the given predictions and ground truth for each stress factor, ignores observation rows with Nan values |
| DecisionTree |
| LDA |
| SVM |
| KNN |
| BaggedTrees |
| SubspaceDiscriminant |
| SubspaceKNN |
| RUSBoostedTrees |
