Plot a pretty confusion matrix (like Matlab) in python using seaborn and matplotlib
This module lets you plot a pretty looking confusion matrix from a np matrix or from a prediction results and actual labels.
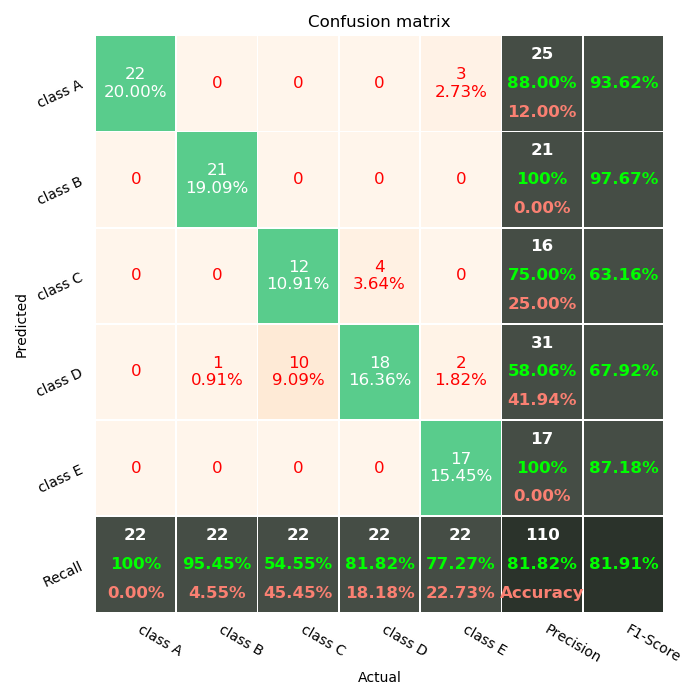
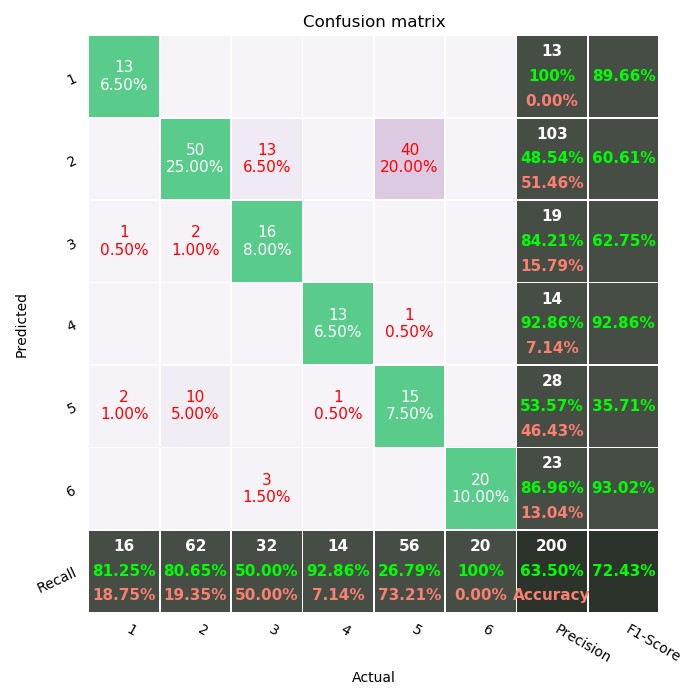
Sample plots:
pip install confplot# import package
import confplot
# assume you have a confusion matrix array like this
array = np.array(
[[13, 0, 1, 0, 2, 0],
[ 0, 50, 2, 0, 10, 0],
[ 0, 13, 16, 0, 0, 3],
[ 0, 0, 0, 13, 1, 0],
[ 0, 40, 0, 1, 15, 0],
[ 0, 0, 0, 0, 0, 20]]
)
# convert it to a pandas dataframe
df_cm = DataFrame(array, index=range(1, 7), columns=range(1, 7))
# create and save confusion matrix plot as "cm_plot.png"
confplot.plot_confusion_matrix_from_matrix(df_cm, outfile="cm_plot.png")# import package
import confplot
# assume you have 1D y_true (actual values) and y_pred (predictions) arrays
y_true = ...
y_pred = ...
# arange targetclass names if you want
columns = ["ahududu", "ananas", "armut", "avokado", "ayva"]
# create and save confusion matrix plot as "cm_plot.png"
confplot.plot_confusion_matrix_from_data(
y_true,
y_pred,
columns,
outfile="cm_plot.png"
)
