UWB has taken the tech world by storm with its pinpoint location tracking, snappy short-range communication, and cool applications in IoT, smart homes, and the automotive realm. 📡🏠🚗
But wait, there's a twist! 🔄
Enter the Non-Line-of-Sight (NLOS) conundrum 🌫️. Sometimes, UWB signals go all detective mode, bouncing off obstacles and reflective surfaces, causing delays and messing up distance measurements. 😬
Imagine your GPS telling you that you're casually swimming in the nearby lake when you're just sipping coffee at a cafe nearby. NLOS can be that sneaky. 🏊♂️🍵
That's where this repo swoops in with capes and machine learning magic! ✨
While using machine learning to tackle signal hiccups isn't new, it's all the rage right now. 🧙♂️✨
But, here's the scoop: Most research focuses on sorting things into either "Line-of-Sight" or "Non-Line-of-Sight." We're here to make things more interesting and fine-tuned! 🤓
This project aims to bring some order to the NLOS chaos. 🧐
The idea? Different NLOS-causing materials might have unique quirks, or one can group them into categories like "soft-NLOS" or "hard-NLOS." 🤖📊
So, if you're ready to dive into the world of UWB, machine learning, and a sprinkle of detective work, welcome aboard! 🕵️♀️🚀
-
📦 archieve
- This folder hosts everything that was important but is no longer in the spotlight.
-
📊 baseline_classification
- Welcome to the lab! Here, we conduct all our baseline experiments, the foundational tests of our project.
-
📈 data_analysis
- Think of this folder as our data playground. Here, we dive deep into numbers, charts, and graphs to uncover hidden insights and patterns.
-
🖼️ figures
- In this folder, we treasure our visual gems. These are the figures and visuals that bring our data to life. Safety first, so they have their own special place.
-
🚀 final_experiments
- This is where the magic happens! We keep the most valuable experiments here, the ones that truly emphasize our theories and findings. It's where we showcase the crown jewels of our research.
| Metric | Value |
|---|---|
| Accuracy | 99.94% |
| Precision | 99.96% |
| Recall | 99.94% |
| F1-Score | 0.9994 |
| Metric | Value |
|---|---|
| Accuracy | 73.14% |
| Precision | 73.05% |
| Recall | 73.14% |
| F1-Score | 0.7299 |
| Metric | Value |
|---|---|
| Accuracy | 86.69% |
| Precision | 76.75% |
| Recall | 77.24% |
| F1-Score | 0.7690 |
| Metric | Value |
|---|---|
| Accuracy | 81.11% |
| Precision | 81.29% |
| Recall | 81.27% |
| F1-Score | 0.8121 |
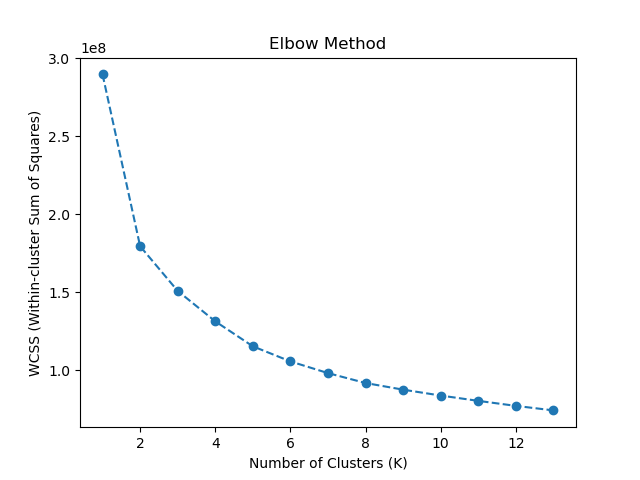
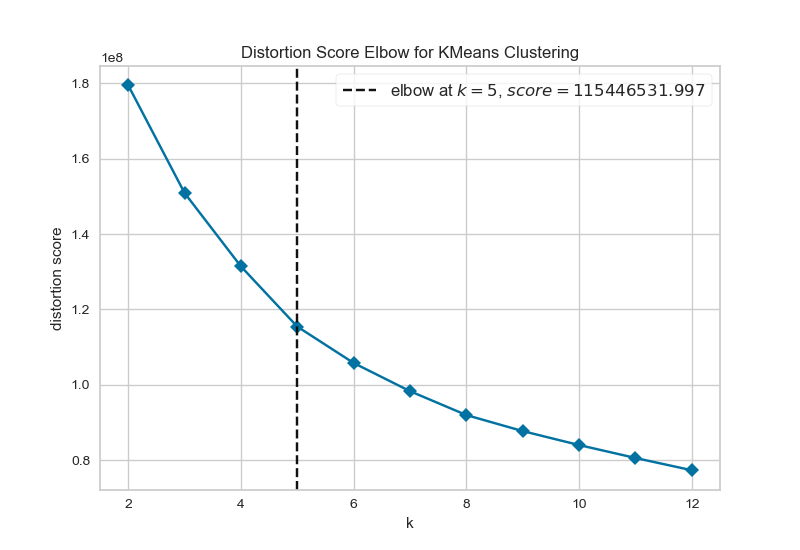
WCSS measures the variance of data points within each cluster. It quantifies how compact the clusters are. Smaller WCSS values indicate tighter clusters.
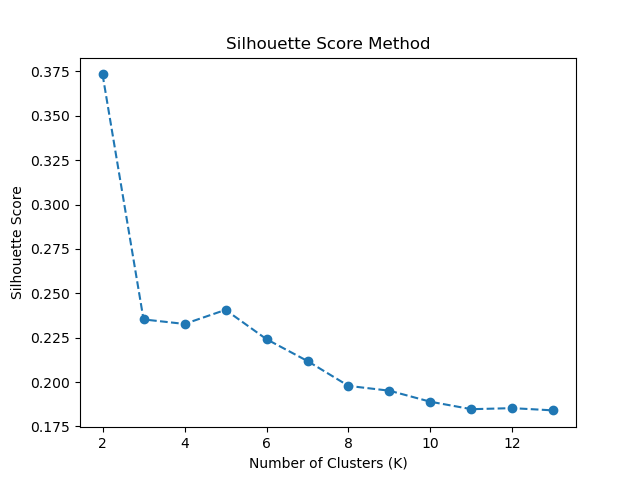
The silhouette score measures how similar each data point is to its own cluster compared to other clusters. A higher silhouette score indicates that the data points are well-separated into clusters.


