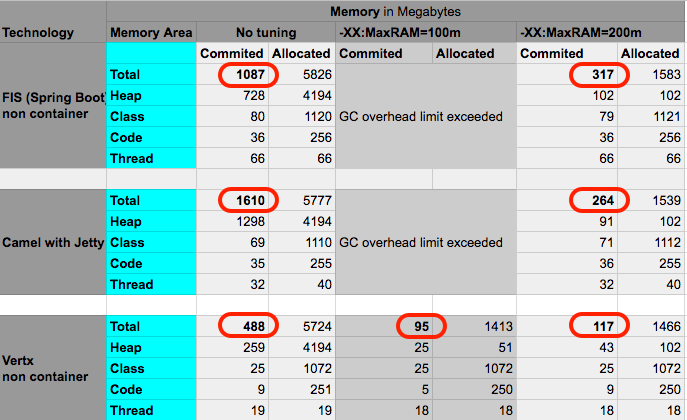
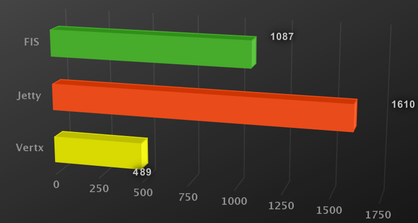
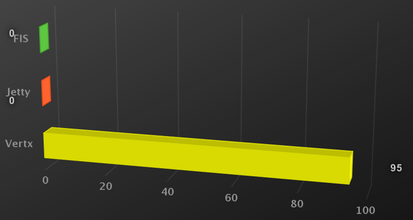
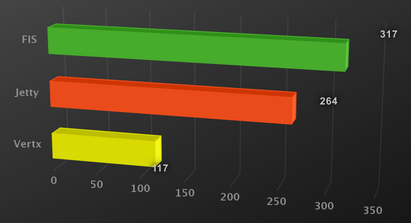
The objective of this report is compare memory usage by Apache Camel in a simple route, this simple route expose a CRUD rest operation with 50 objects persisted in a IMDB in different scenarios.
-
Camel with Spring Boot
-
Camel with Jetty
-
Vertx (no camel) - I tested with Vertx to compare the memory consumption with a non camel application.
All data was collected with 10 request per second of load.
The test was did using one Macbook Pro (Retina, 13-inch, Late 2013):
macOS Sierra (Version 10.12.6)
Processor 2,8 GHz Intel Core i7
Memory 16 GB 1600 MHz DDR3
-
Java version "1.8.0_131"
-
Apache Maven 3.5.0
Project: jvm-analisys/fis-rest
export MAVEN_OPTS='-XX:NativeMemoryTracking=summary -XX:MaxRAM=100m'; mvn spring-boot:run
Project: jvm-analisys/camel-examples/camel-example-restlet-jdbc
load database
for i in {1..50}
do
      curl -X POST -d "firstName=test&lastName=person" http://localhost:8080/rs/persons;
done
export MAVEN_OPTS="-XX:NativeMemoryTracking=summary -XX:MaxRAM=100m"; mvn jetty:run -Dimpl=java-rest-dsl
Result: GC overhead limit exceeded.
export MAVEN_OPTS="-XX:NativeMemoryTracking=summary -XX:MaxRAM=100m"; mvn jetty:run -Dimpl=java-rest-dsl
The sample used in vertx is the following: /web-examples/src/main/java/io/vertx/example/web/rest/SimpleREST.java
I ran the class direct by the IDE (main method).
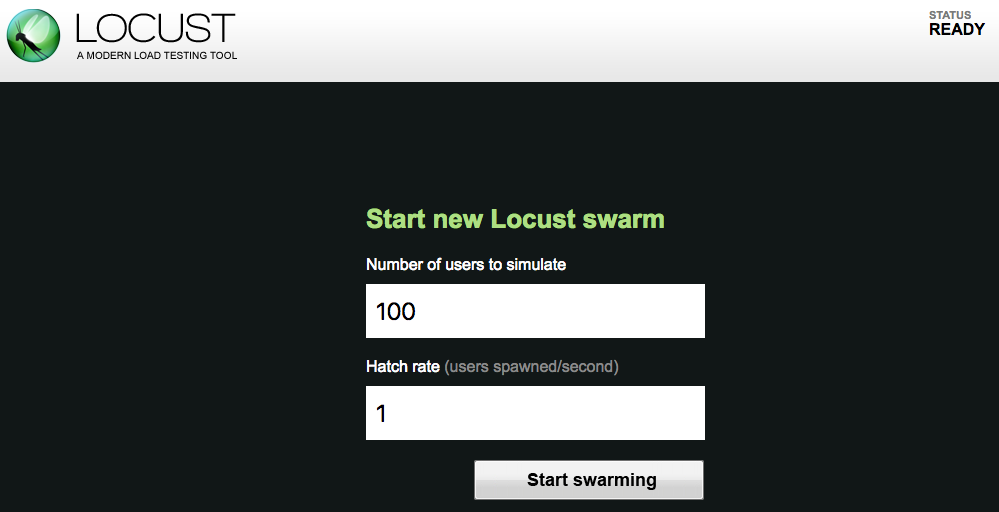
The testing tool used was Locust. All data was collected with a 10 request per second load.
To run the load test use:
locust -f <project-path>/load-test.py --host=http://localhost:8080
After that access the web console: http://localhost:8089/
I used 100 users with 1 of hatch rate.
The metrics was collected using Java Memory Tracking jdk tool with the option summary.
To simplify the collect proccess I developed this tool https://github.com/hodrigohamalho/jmt-analyzer
