Visualization tools for cnns and tracking
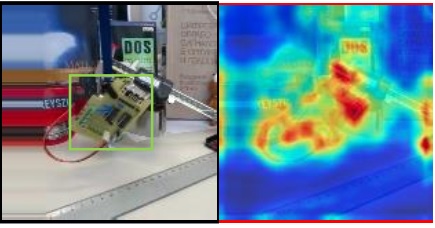
heatmap2D (a 2D matrix response add with origin image). [code]
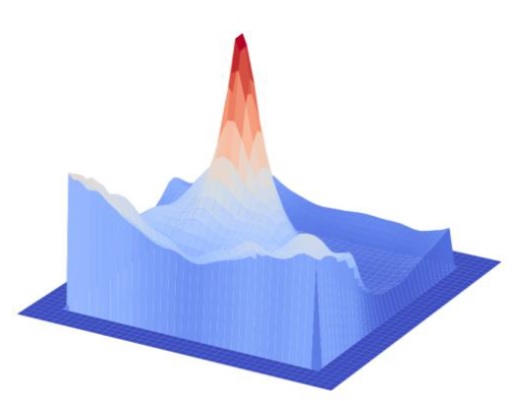
heatmap3D (a 2D matrix response). [code]
View tracking bboxes from txt result (as a qualitative compare of trackers). [code]
Tracking IoU vs target size (result txts). [code]
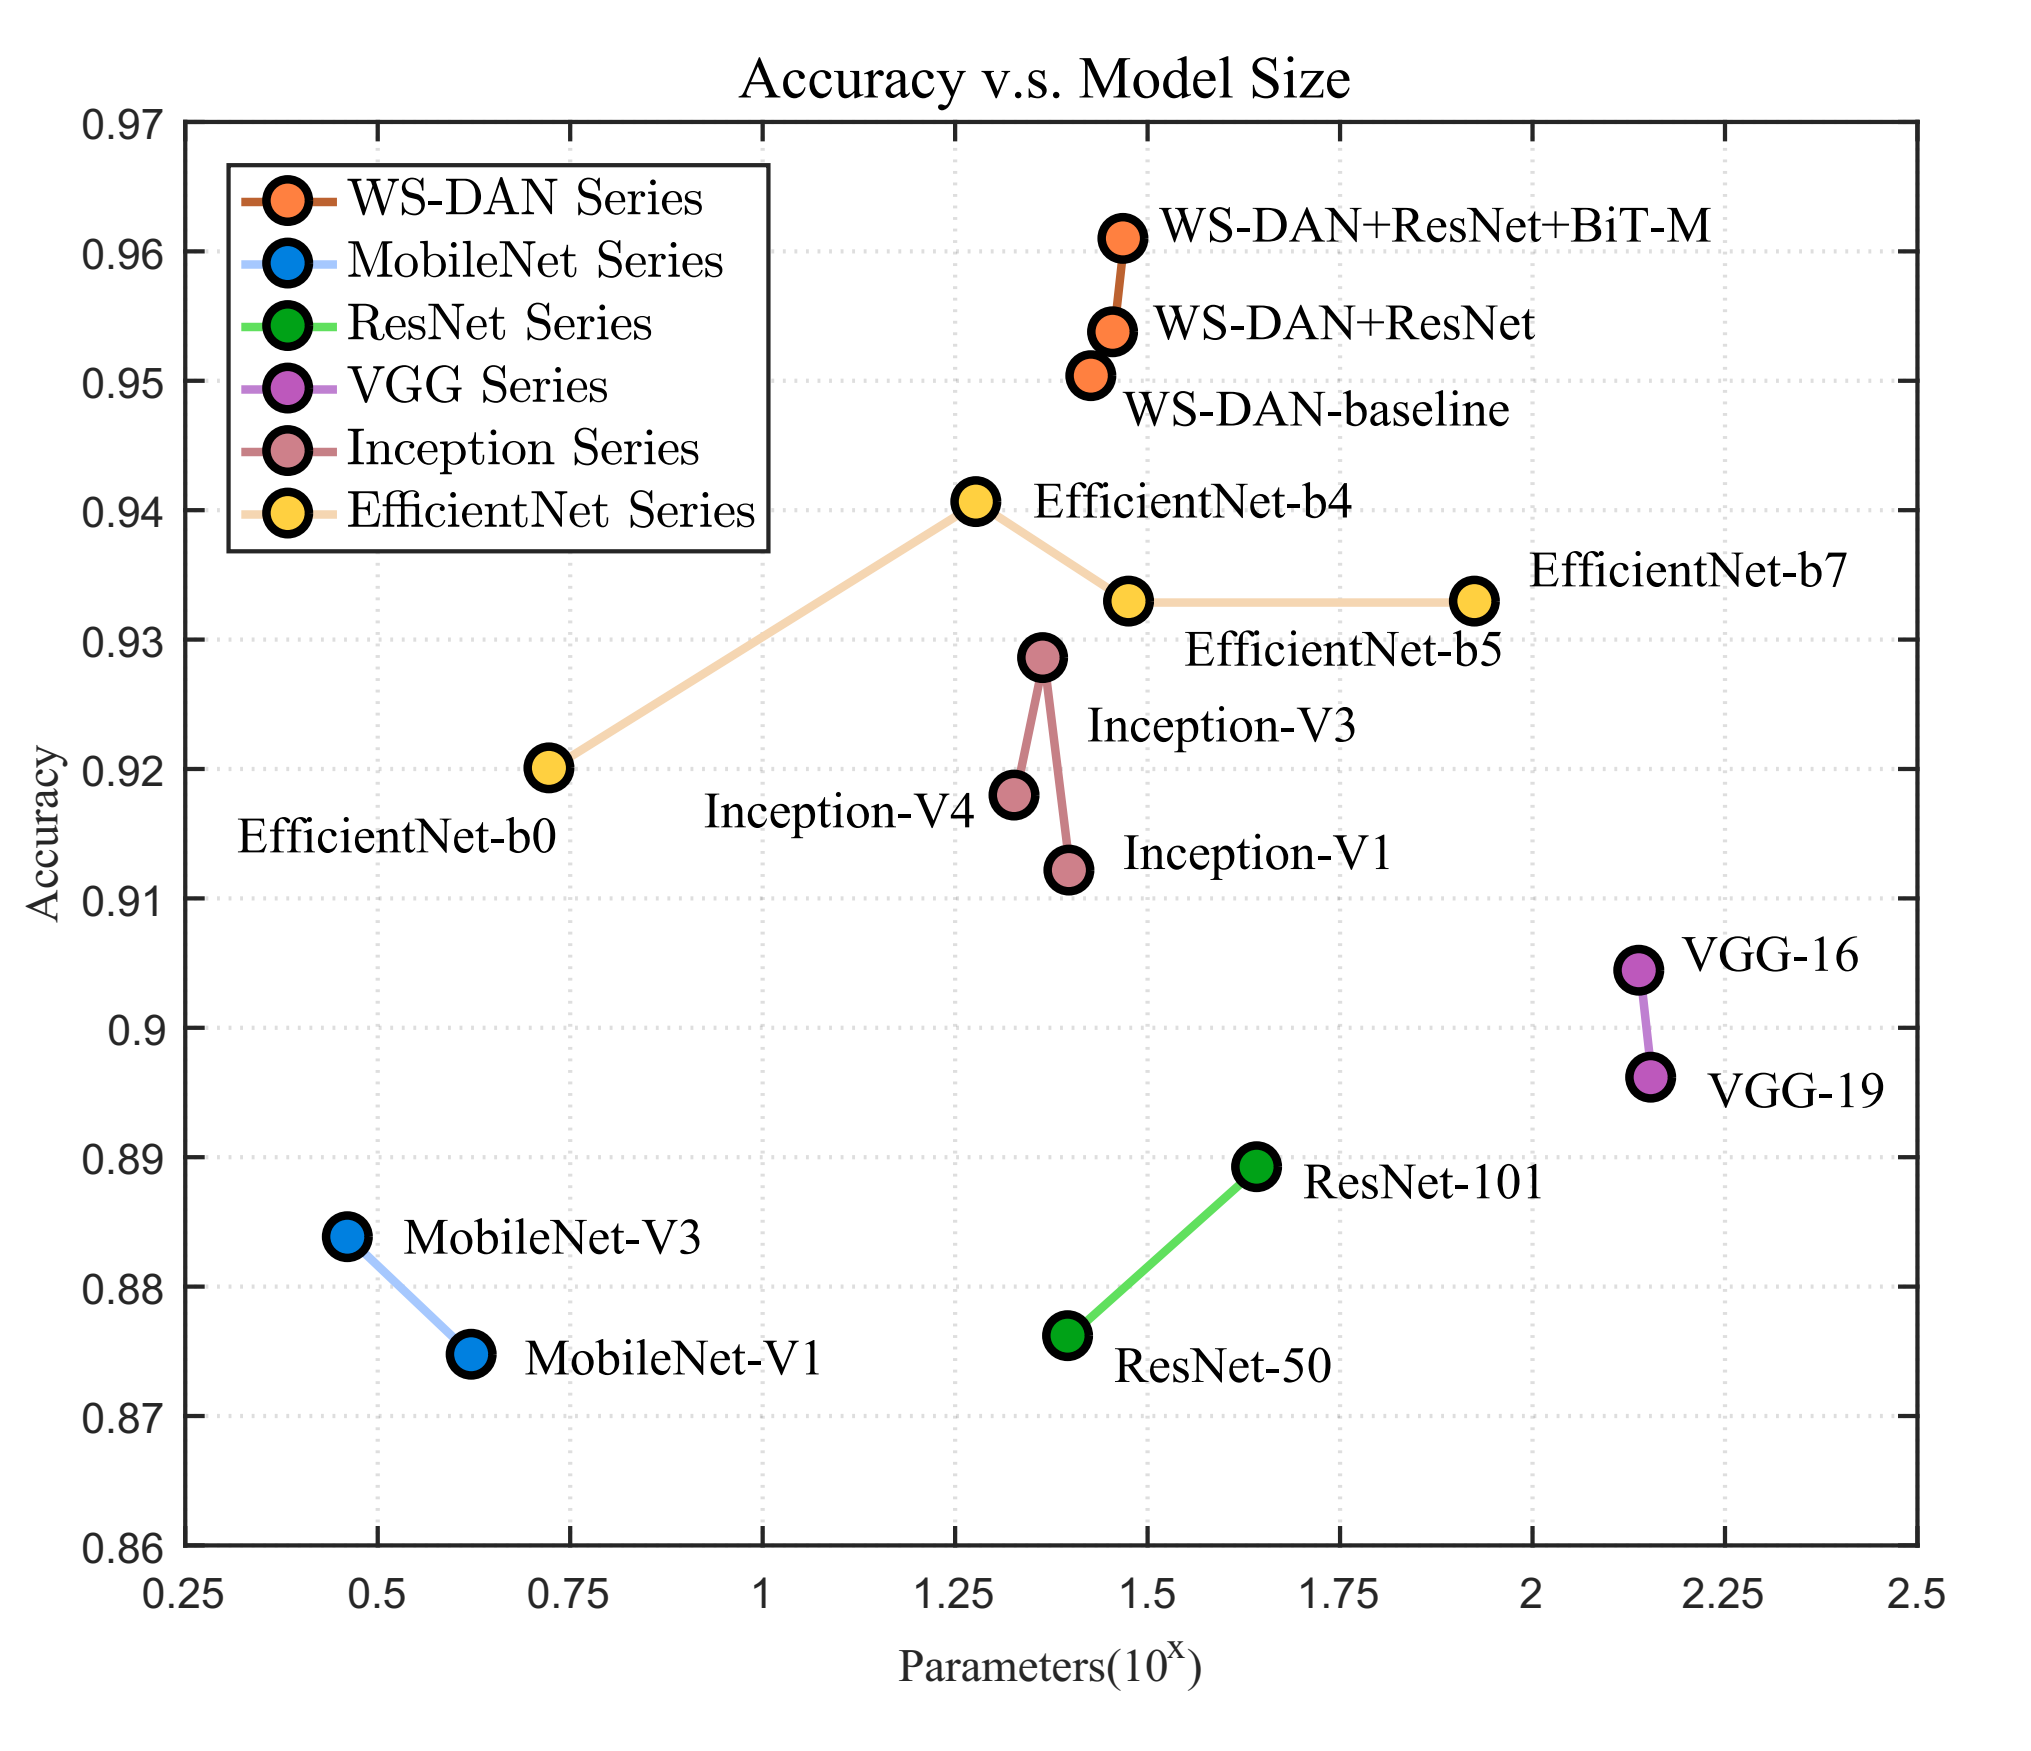
Draw a 2D plot, e.g. ACC v.s. Parameter. [matlab_code]
The label may need fine-tune manually by pdf editer like Acrobat.


