Vehicle Detection Project
The goals / steps of this project are the following:
- Perform a Histogram of Oriented Gradients (HOG) feature extraction on a labeled training set of images and train a Linear SVM classifier
- Optionally, you can also apply a color transform and append binned color features, as well as histograms of color, to your HOG feature vector.
- Note: for those first two steps don't forget to normalize your features and randomize a selection for training and testing.
- Implement a sliding-window technique and use your trained classifier to search for vehicles in images.
- Run your pipeline on a video stream (start with the test_video.mp4 and later implement on full project_video.mp4) and create a heat map of recurring detections frame by frame to reject outliers and follow detected vehicles.
- Estimate a bounding box for vehicles detected.
Rubric Points
Here I will consider the rubric points individually and describe how I addressed each point in my implementation.
1. Provide a Writeup / README that includes all the rubric points and how you addressed each one. You can submit your writeup as markdown or pdf. Here is a template writeup for this project you can use as a guide and a starting point.
You're reading it!
1. Explain how (and identify where in your code) you extracted HOG features from the training images.
The code for this step is contained in the third code cell of the IPython notebook, in the function called get_hog_features. The data set is explored with the use of this function in the forth code cell and is additionally called from the function extract_features defined in the fifth code cell.
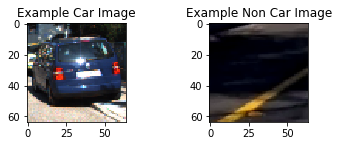
I started by reading in all the vehicle and non-vehicle images. Here is an example of one of each of the vehicle and non-vehicle classes:
I then explored different color spaces and different skimage.hog() parameters (orientations, pixels_per_cell, and cells_per_block). Here is an example of what some different color spaces looks like for a test images from video.
I grabbed random images from each of the two classes and displayed them to get a feel for what the skimage.hog() output looks like. Here is an example using the YCrCb color space and HOG parameters of orientations=11, pixels_per_cell=(8, 8) and cells_per_block=(2, 2):
I tried various combinations of parameters and tried to see how the HOG visualisation changed to get an understanding of what could be possible good parameters. I thereafter tried to train on a small data set with some of the different combinations of parameters, by changing one parameter at a time. I saw that some values did increase the classification accuracy and other decreased it.
3. Describe how (and identify where in your code) you trained a classifier using your selected HOG features (and color features if you used them).
I trained a linear SVM using both HOG and color features (histogram and binned color). I train the classifier in the 8th code cell of my IPython notebook. I chose to train with the additional parameter "probability", to be able to use the probability to reduce false positives when classifying new images.
To come up with the best data to use for the classifier I used a smaller data set and tried different color spaces with different parameters. I changed one parameter at a time and checked if it increased or decreased the accuracy. I saw that using HOG for all 3 channels on a YCrCb image with color features as mentioned above gave a good result. My final parameter choice were (can be seen in code cell 7):
color_space = 'YCrCb' # Can be RGB, HSV, LUV, HLS, YUV, YCrCb
orient = 11  # HOG orientations
pix_per_cell = 8 # HOG pixels per cell
cell_per_block = 2 # HOG cells per block
hog_channel = "ALL" # Can be 0, 1, 2, or "ALL"
spatial_size = (32,32) # Spatial binning dimensions
hist_bins = 32    # Number of histogram bins
spatial_feat = True # Spatial features on or off
hist_feat = True # Histogram features on or off
hog_feat = True # HOG features on or off
I was training my classifier on the GTI and KITTI data sets. I chose to only use every 5th image of the GTI-data since some of the images were very similar, and thereafter chose 6000 images from the vehicle and 6000 images from non-vehicle data. This can be seen in the 6th and 7th code cell. My final SVM got an accuracy of 0.9942.
1. Describe how (and identify where in your code) you implemented a sliding window search. How did you decide what scales to search and how much to overlap windows?
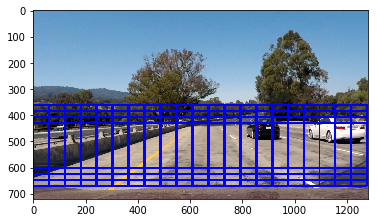
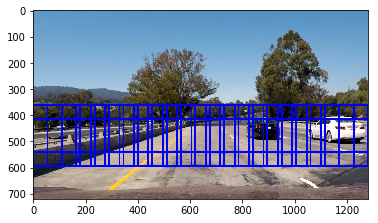
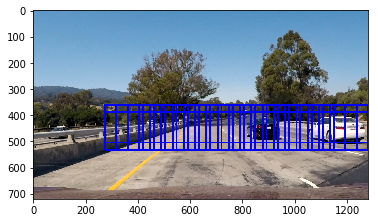
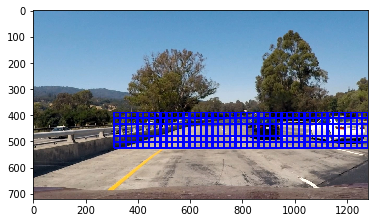
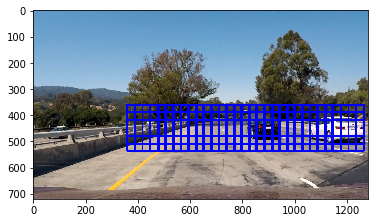
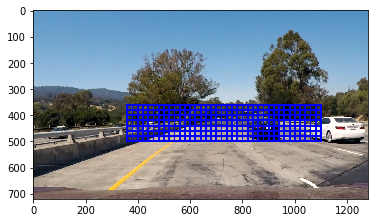
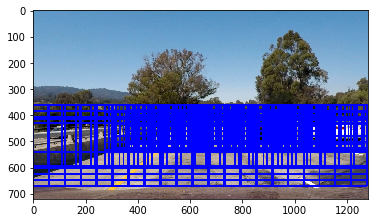
The code for my sliding window search can be seen in code cell 10, where the function used for searching is called search_windows() and to create search windows slide_window(). I decided to use only the lower half of the image (in y), thereafter I used some different sizes and restricted the search area depending on size. The smaller size, the smaller search area were used (less part of area closest to vehicle were used).
To know what sizes that would be good I tried the sliding window search on the test images. I checked what size detected vehicles in different images and fine tuned the sizes and overlap accordingly. I realized that the choice of windows influenced the detection a lot. I then tried my detection on some of the images from the video and corrected the sizes/added more sizes when needed to make a better detection. In the end I think that I may have got a little bit too many windows (499), so this can still be improved.
Here are the windows that I search for in an image (defined in code cell 11):
2. Show some examples of test images to demonstrate how your pipeline is working. What did you do to optimize the performance of your classifier?
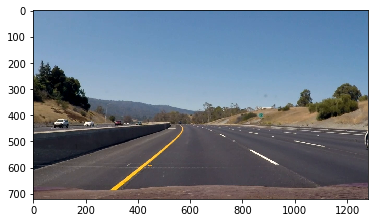
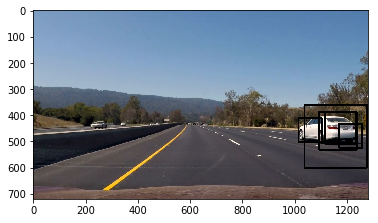
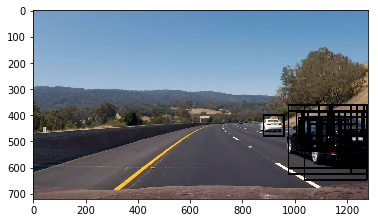
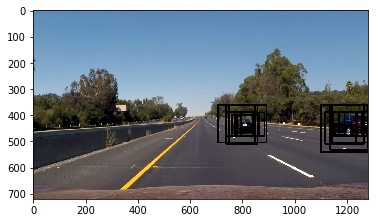
I searched on all my windows using YCrCb 3-channel HOG features plus spatially binned color and histograms of color in the feature vector, which provided a nice result. Here are some example images:
1. Provide a link to your final video output. Your pipeline should perform reasonably well on the entire project video (somewhat wobbly or unstable bounding boxes are ok as long as you are identifying the vehicles most of the time with minimal false positives.)
Here's a link to my video result
2. Describe how (and identify where in your code) you implemented some kind of filter for false positives and some method for combining overlapping bounding boxes.
First of all I chose to only consider windows where the classifier were at least 70% sure that it was a vehicle detected (17th code cell of my notebook, in function search_windows()). This lead to a reduction of false positives. To improve futher I recorded the positions of positive detections in each frame of the video. Based on the five last frames' detections I created a heatmap and then thresholded that map to identify vehicle positions. In the beginning of the drive (first five frames), I do not do any thresholded heatmap but instead use all the detected windows directly. This can be seen in the 18th code cell of my notebook.
To construct the bounding boxes I used scipy.ndimage.measurements.label() to identify individual blobs in the heatmap. I then assumed each blob corresponded to a vehicle. I constructed bounding boxes to cover the area of each blob detected. This can be seen in code cell 18, which calls function draw_labeled_bboxes() defined in cell 17.
Here's an example result showing the heatmap from a series of frames of video and the bounding boxes overlaid on the last frame of video:
1. Briefly discuss any problems / issues you faced in your implementation of this project. Where will your pipeline likely fail? What could you do to make it more robust?
Here I'll talk about the approach I took, what techniques I used, what worked and why, where the pipeline might fail and how I might improve it if I were going to pursue this project further.
The most important thing I realized during this project was that it was important to get the sliding windows good to capture the vehicles. Sometimes I would detect vehicles good with a window size and if I just changed the windows sligthly the same vehicle was not detected. The approach I took to choose windows is something I would like to improve to make a more robust but also a faster solution. I especially have difficulties detecting vehicles that are further away, my window size does seem to be too big for those vehicles.
First of all my pipeline is not reasonable to be used in a real life application, because it is too slow. The HOG feature extraction is really slow, so I would like to explore other methods to deal with this. Decreasing the number of searching windows and doing subsampling of the image would maybe improve the computational performance as well.
One idea I have is to search for new vehicles only in the outer edges of the image, since they should not just randomly appear in the middle without passing the edges of the images. If we would track the other vehicles speed for example we could predict where they would most likely be in the next frame and use this information to search for vehicles that we have already detected.
Another thing to improve is the bounding boxes, the boxes should ultimately get tigher around the vehicle. In the implementation I have right now it would not improve if I increased the threshold in the heat map, since it results in that I lose the vehicles more often. If I was going to use an approach like that I will first need to make sure that the vehicles are detected in more windows, in all scenarios. I would like to try to add a moving average or similar to define the box positions to make sure that they are not jumping around that much.
During the project I had quite some issues with the different color spaces that images are loaded in. I used matplotlib to load the images but I think that I would like to change it to opencv, since now I needed to make sure to scale the images properly. I needed to debug quite some times because of this error.
