Chronos is a comprehensive developer tool that monitors the health and web traffic of servers, microservices, and containers. Use Chronos to see real-time data monitoring and receive automated notifications over Slack or email.
Return to Top
- Metric query tool so you can filter out specific metrics — now you only have to see what you want on the dashboard.
- Additional metrics added, bringing Chronos up from only 12 to 100+ metrics that are currently available
- Option to filter by category and individual metric, and flip between services and categories with ease
- Apache Kafka monitoring capability, all you need to do is run Prometheus JMX exporter on the system your Chronos application is running on. A sample JMX config.yaml file is provided in the Chronos repository for a quick and easy setup, however you are free to configure however you like.
- Bug fixes and UI tweaks — Chronos is now a more seamless experience than ever.
- Distributed tracing enabled across microservices applications
- Compatible with

- Supports
 and
and  databases
 - Displays real-time temperature, speed, latency, and memory statistics
- Display and compare multiple microservice metrics in a single graph
- Monitor an
 cluster via the JMX Prometheus Exporter
Return to Top
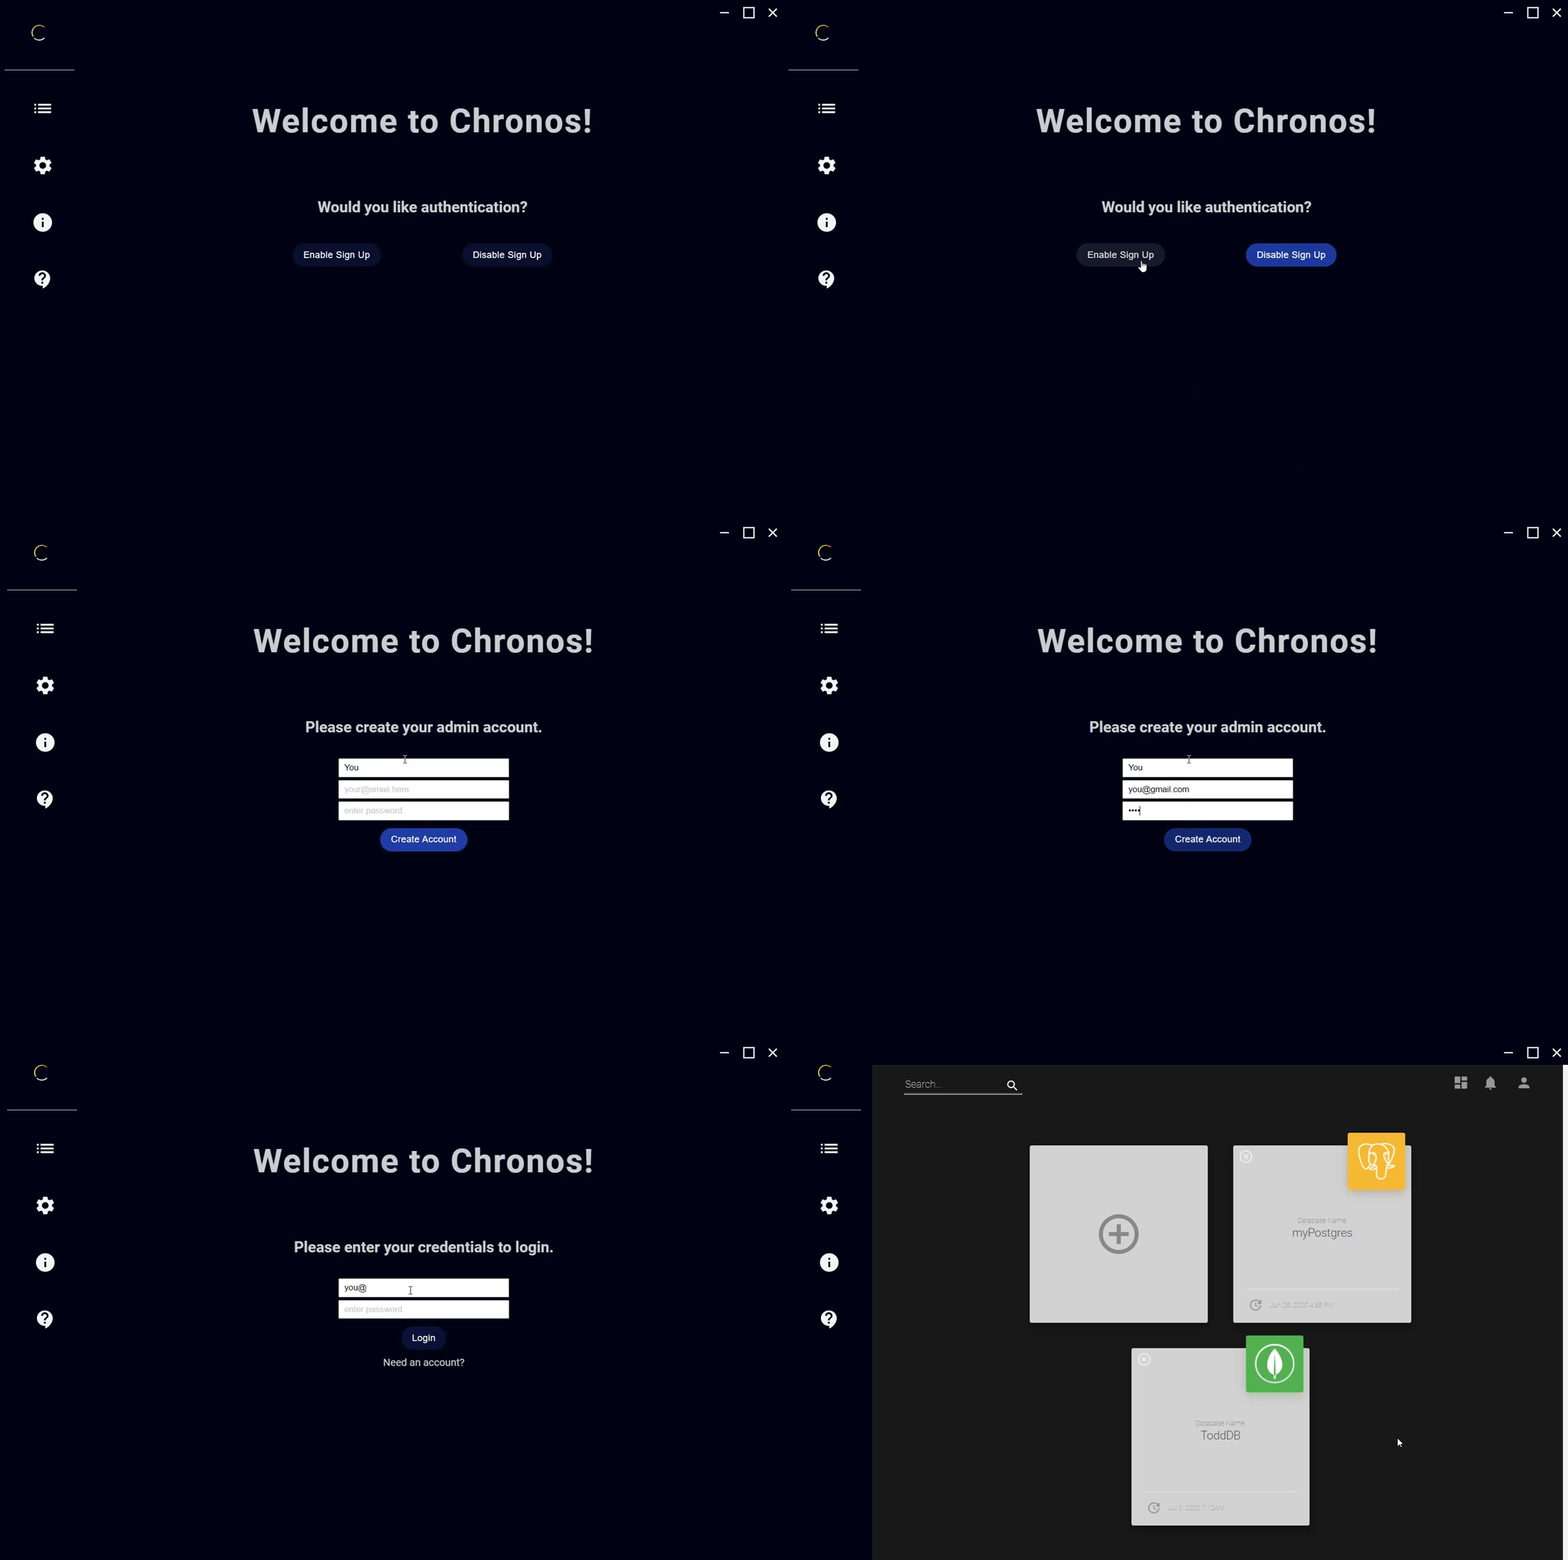
Signing Up

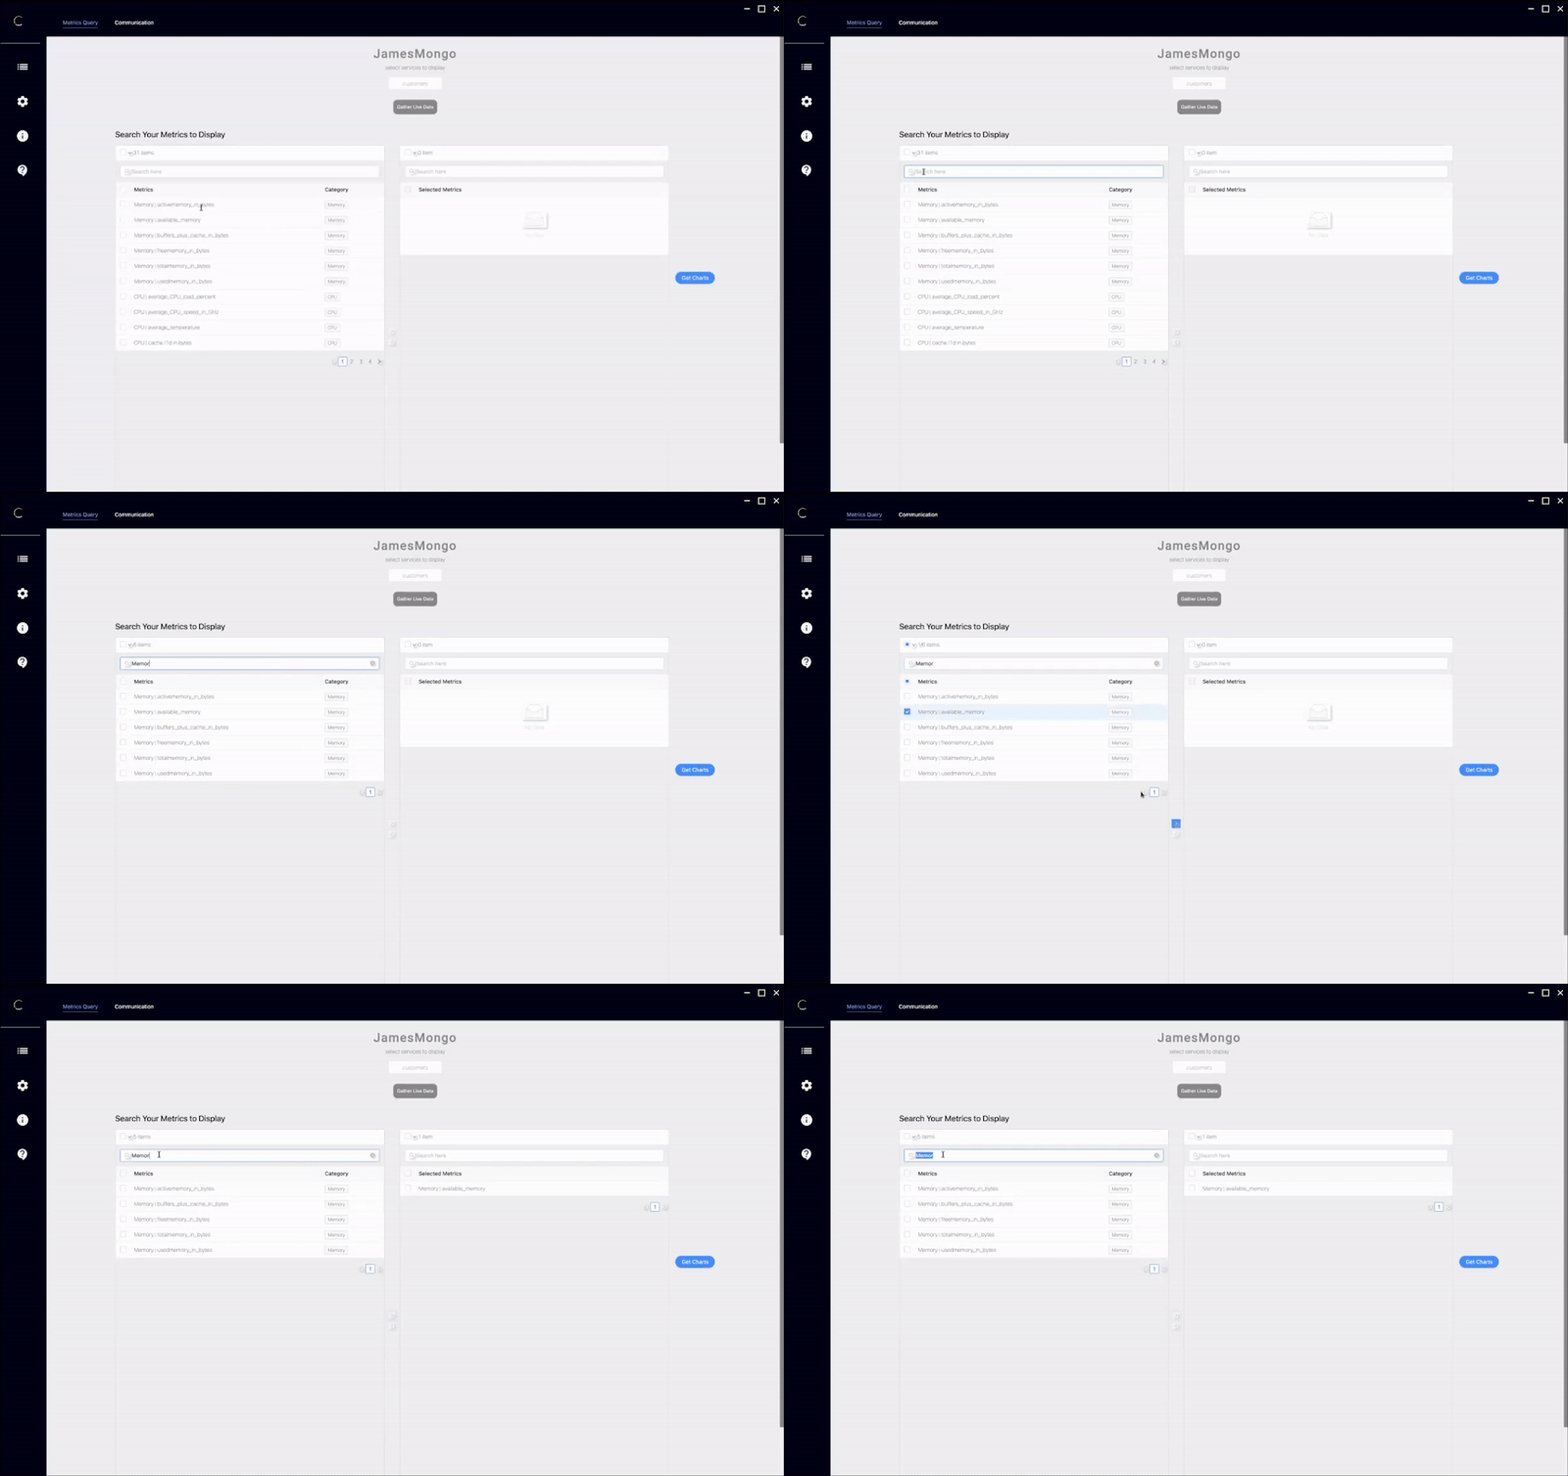
Using the Query Tool

Return to Top
This is for the latest Chronos version 5.2 release and later.
- Stable release: 7.0.0
- LTS release: 7.0.0
Make sure you're running version 14.16.1 of ![]() , which is the most recent LTS (long-term support) version.
, which is the most recent LTS (long-term support) version.
If you need to roll back from ![]() 16.1.0, make sure to run
16.1.0, make sure to run
npm rebuild
in the root directory.
If you're installing Chronos into a microservices application, and you have different folders for each microservice, make sure you also run
npm rebuild
in each microservices folder after you roll back to version 14.16.1.
If you wish to launch the Electron Application in an WSL2 envirronment(Ubuntu) you may need the following commands for an Electron window to appear
-
Install VcXsrv
-
Run the following command in the terminal
sudo apt install libgconf-2-4 libatk1.0-0 libatk-bridge2.0-0 libgdk-pixbuf2.0-0 libgtk-3-0 libgbm-dev libnss3-dev libxss-dev
- After running your VcXsrv instance, run the following command in the terminal
export DISPLAY="`sed -n 's/nameserver //p' /etc/resolv.conf`:0"
To use Chronos in your existing application, download and install the following in the root directory of each of your microservice applications:
npm install chronos-tracker-7
Similarly, in the root directory of each of your microservice applications, create a chronos-config.js file with properties listed below:
// A sample `chronos-config.js` file

const chronos = require('chronos-tracker-7');

chronos.use({
  microservice: 'payments',
  interval: 5000,
  dockerized: true, // <-- The 'dockerized' property is optional
  database: {
    connection: 'REST',
    type: 'MongoDB',
    URI: process.env.URI,
  },
  notifications: [],
});
The microservice property takes in a string. This should be the name of your server or microservice. For Docker containers, the name of the microservice should be the same as the name of the corresponding Docker container.
The interval property is optional and takes in an integer. This controls the Chronos monitoring frequency. If this is omitted, Chronos will default to recording server health every 60000 ms or 60 seconds.
The dockerized property is optional and should be specified as true if the server is running inside of a Docker container. Otherwise, this should be false. If omitted, Chronos will assume this server is not running in a container.
The database property is required and takes in the following:
connectionshould be a string and only supports 'REST' and 'gRPC'typeshould be a string and only supports 'MongoDB' and 'PostgreSQL'.URIshould be a connection string to the database where you intend Chronos to write and record data regarding health, HTTP route tracing, and container infomation. We reccommend using dotenv
You will also need to add the following two lines of code to your express server:,
// Example for REST
const express = require('express');
const app = express();
you will also need to require in chronos-tracker-7 and initialize Chronos, as well as the ./chronos-config file in addition to implementing chronos.track() for all endpoints.
const chronos = require('chronos-tracker-7');
require('./chronos-config'); // Bring in config file

// ...

app.use('/', chronos.track());
You should be good to go! The steps below for Docker Configuration and Kafka Configuration, are only applicable if you need to configure ![]() or Kafka for your application. See the Notifications section below for information on how to uses the notifications propery in
or Kafka for your application. See the Notifications section below for information on how to uses the notifications propery in chronos-config.js.
Wherever you create an instance of your server (see example below),
  // Example of gRPC server
  const server = new grpc.Server();

  server.bindAsync("127.0.0.1:30044", grpc.   ServerCredentials.createInsecure(), () => {
    server.start();
    console.log("Server running at http://127.0.0.1:30044");
});
you will also need to require Chronos-tracker, Chronos-config, and dotenv.config(if this is used). For health data, simply use Chronos.track()
//track health data
const chronos = require('chronos-tracker-7');
require('./chronos-config');
require('dotenv').config(); // set up environment variables in .env
const BookModel = require('./BookModel');

chronos.track()
To trace requests, first wrap the gRPC client using Chronos
const grpc = require('@grpc/grpc-js');
const protoLoader = require('@grpc/proto-loader');
const chronos = require('chronos');

const PROTO_PATH = './order.proto';

const packageDefinition = protoLoader.loadSync(PROTO_PATH, {
  keepCase: true,
  longs: String,
  enums: String,
  arrays: true,
});
const OrderToBookService = grpc.loadPackageDefinition(packageDefinition).OrderToBook;
const bookClient = new OrderToBookService('localhost:30044', grpc.credentials.createInsecure());

const ClientWrapper = chronos.ClientWrapper(bookClient, OrderToBookService);
Next wrap the gRPC server using Chronos
  const ServerWrapper = chronos.ServerWrapper(server,  Proto.protoname.service, {
    AddBook: (call, callback) => {
    // console.log(call.metadata)
    // get the properties from the gRPC client call
      const { title, author, numberOfPages, publisher, bookID } = call.request;
    // create a book in our book collection
      BookModel.create({
        title,
        author,
        numberOfPages,
        publisher,
        bookID,
      });
      callback(null, {});
    },
  });
For any request you wish to trace, require uuidv4 and write the following code where the initial gRPC request begins,
const require { v4: uuidv4} = require('uuid')
const createMeta = () => {
  const meta = new grpc.Metadata();
  meta.add('id', uuidvd());
  return meta
}
and then, invoke createMeta as a third argument to any client method that is the beginning of the request path.
orderClient.AddOrder(
    order,
    (err, data) => {
      if (err !== null) {
        console.log(err);
        // could not add order because bookID does not exist
        return res.sendStatus(404);
      }
      console.log('addOrder response: ', data);
      return res.sendStatus(200);
    },
    createMeta()
  );
Finally, on all servers that will be involved in the request path, invoke chronos.link with parameters of client and ServerWrapper in the server wrapper.
chronos.link(client, ServerWrapper);Again, this step is only applicable if you are currently using ![]() containers for your microservices.
containers for your microservices.
![]() Give your containers the same names you pass in as arguments for microservice names.
Give your containers the same names you pass in as arguments for microservice names.
![]() In order to have container statistics saved to your database along with other health info, bind volumes to this path when starting up the containers:
In order to have container statistics saved to your database along with other health info, bind volumes to this path when starting up the containers:
/var/run/docker.sock
For example, you can type the following when starting up a container:
docker run -v /var/run/docker.sock:/var/run/docker.sock [your-image-tag]
If you're using docker-compose to start up multiple containers, you can add a volumes key for each of your services in the docker-compose.yml file:
volumes:
  - "/var/run/docker.sock:/var/run/docker.sock"
Chronos now offers the ability to monitor an Apache Kafka cluster via JMX to Prometheus Exporter. In order for this feature to work you must be running JMX to Prometheus
Exporter either as a Java Agent with your cluster or as a standalone HTTP server. Then, use chronos-config.js to specifiy the port exposed for metrics scraping.
To start, add the property jmxuri to the object in chronos-config.js. Your file should look similar to below. Add this property to chronos-config.js in *ONE AND ONLY ONE of your microservices:
const chronos = require('chronos-tracker-7');

chronos.use({
  microservice: 'payments',
  interval: 5000,
  dockerized: true,
  jmxuri: // your URI here
  database: {
    connection: 'REST',
    type: 'MongoDB',
    URI: process.env.URI,
  },
  notifications: [],
});
The jmxuri property should be a string whose value is the port specified for scraping when starting the exporter.
Then, in *ONE AND ONLY ONE of your microservices, call
chronos.kafka()in your express server. When viewing your information in the Chronos Electron application the data will be available in the service "kafkametrics"
NOTE: We provide a config.yaml file in the Chronos root folder for use with JMX prometheus that provides some useful baseline metrics to monitor.
Return to Top
Once you have configured and intialized Chronos Tracker, it will automatically record monitoring data when your servers are running. Finally, start the Chronos desktop app to view that data! After cloning our GitHub repo, run npm install and npm run both to start Chronos.
At the current moment, to get a copy of the executable that works on all OS, the steps are 1) clone the master branch, 2) run npm i, 3) run npm run prepareDist, 4) run npm run package-any, 5) navigate in your Chronos folder ./release-builds/resources and click on chronos.exe. 6) optionally right click to create a shortcut.
Return to Top
The notifications property is optional and allows developers to be alerted when the server responds to requests with status codes >= 400. To set up notifications, set the value of the notifications property to an array of objects, each with a type and settings property.
Chronos only supports Slack and email notifications.
Chronos uses the ![]() API to send messages to a Slack channel and only requires the webhook url. Learn how to set up Slack webhooks for your team.
API to send messages to a Slack channel and only requires the webhook url. Learn how to set up Slack webhooks for your team.
An example of configured slack settings:
// ...
notifications: [
  {
    type: 'email',
    settings: {
      slackurl: process.env.WEBHOOK
    }
  }
]
// ...Chronos provides the option to send ![]() emails. The properties that should be provided are the following
emails. The properties that should be provided are the following
emails- The recipient list (string) can be a single email address or multiple as comma seprated values.emailHost- The smtp host (string) of your email serveremailPort- The email port (integer) is either 465 or 587 depending on the sender email security settings. Learn more about email ports by reading the nodemailer docsuser- The email address (string) of the senderpassword- The password (string) of the sender email
NOTE: Email notification settings may require alternative security settings to work
An example of configured email settings:
// ...
notifications: [
  {
    type: 'email',
    settings: {
      emails: 'foobar@email.com, bizbaz@email.edu',
      emailHost: 'smpt@gmail.com',
      emailPort: 465,
      user: process.env.SENDER_EMAIL,
      password: process.env.SENDER_PASSWORD
    }
  }
]
// ...
Return to Top
The 'master' branch of this repository is where the ![]() application for Chronos is deployed. The Chronos monitoring tool includes two database examples, one PostgresQL and one MongoDB, with sample data sets.
application for Chronos is deployed. The Chronos monitoring tool includes two database examples, one PostgresQL and one MongoDB, with sample data sets.
NOTE: To replace or delete these two databases, simply change the database URIs stored in the following path:
root directory -> electron -> user -> settings.json
We provide two working example microservice applications in the master branch for you to test out Chronos: microservices and docker.
In the microservices folder, we provide a sample microservice application that successfully utilizes Chronos to apply all the powerful, built-in features of our monitoring tool. You can then visualize the data with the ![]() app.
app.
Refer to the README in the microservices folder for more details.
In the ![]() folder within the
folder within the master branch, we provide a sample dockerized microservices application to test out Chronos and to apply distributed tracing across different containers for your testing convenience.
The docker folder includes individual ![]() files in their respective directories. A docker-compose.yml is in the root directory in case you'd like to deploy all services together.
files in their respective directories. A docker-compose.yml is in the root directory in case you'd like to deploy all services together.
Refer to the README in the docker folder for more details.
This is the branch that holds the code base for the splash page. Edit the website by first running git clone -b chronosWebsite https://github.com/open-source-labs/Chronos.git . and then updating the aws S3 bucket with the changes.
Return to Top
Return to Top
Development of Chronos is open source on GitHub through the tech accelerator umbrella OS Labs, and we are grateful to the community for contributing bug fixes and improvements. Read below to learn how you can take part in improving Chronos.
Return to Top
Chronos is ![]() licensed.
licensed.


