library(devtools)
install_github("arorarshi/survClust")survClust requires the following packages - stats,survival, pdist, plyr and Rcpp
survClust is an outcome weighted supervised clustering algorithm, designed to classify patients according to their molecular as well as time-event or end point of interest. Until now, sub-typing in cancer biology has relied heavily upon clustering/mining of molecular data alone. We present classification of samples on molecular data supervised by time-event data like Overall Survival (OS), Progression Free Survival etc.
Below is the workflow of proposed survClust method:
-
getDist- Compute a weighted distance matrix based on outcome across givenmdata types. Standardization and accounting for non-overlapping samples is also accomplished in this step. -
combineDist- Integratemdata types by averaging overmweighted distance matrices. -
survClustandcv.survclust- cluster integrated weighted distance matrices viasurvClust. Optimalkis estimated via cross-validation usingcv.survclust. Cross-validated results are assessed over the following performance metrics - the logrank statistic, standardized pooled within-cluster sum of squares and cluster solutions with class size less than 5 samples.
Note: cv.survclust is a wrapper function that will cross-validate and
output cluster assignments. If you run without cross validation and just
the commands on its own getDist, combineDist and survClust,
you are over-fitting!
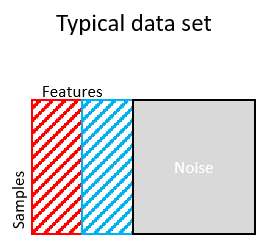
We wish to simulate the structure as discussed in the manuscript. Where, a typical biological dataset has some features related to survival and molecular distinct, some unrelated to survival but molecular distinct and remaining as noise. We will enforce a 3-class structure. See code below.
######################
#simulation to test survival related + survival unrelated
#total samples = 150, total features = 150

set.seed(112)
n1 = 50 #class1
n2 = 50 #class2
n3 = 50 #class3
n = n1+n2+n3
p = 15 #survival related features (10%)
q = 120 #noise

#class1 ~ N(1.5,1), class2 ~ N(0,1), class3 ~ N(-1.5,1)

rnames = paste0("S",1:n)
x = NULL
x1a = matrix(rnorm(n1*p, 1.5, 1), ncol=p)
x2a = matrix(rnorm(n1*p), ncol=p)
x3a = matrix(rnorm(n1*p, -1.5,1), ncol=p)
xa = rbind(x1a,x2a,x3a)
xb = matrix(rnorm(n*q), ncol=q)
x[[1]] = cbind(xa,xb)


################
# sample 15 other informant features, but scramble them.

permute.idx<-sample(1:length(rnames),length(rnames))
x1a = matrix(rnorm(n1*p, 1.5, 1), ncol=p)
x2a = matrix(rnorm(n1*p), ncol=p)
x3a = matrix(rnorm(n1*p, -1.5,1), ncol=p)
xa = rbind(x1a,x2a,x3a)

x[[1]] = cbind(x[[1]],xa[permute.idx,])
rownames(x[[1]]) =  rnames

#true class labels
truth = c(rep(1,50), rep(2,50), rep(3,50)); names(truth) = rnames
Next we simulate a survival dataset with overall survival as the end point with 3 groups with median survival time as 2yrs, 3.25yrs and 4.5yrs respectively.
set.seed(112)
l1 = log(2)/4.5
l2 = log(2)/3.25
l3 = log(2)/2
n = 50

s1<-rexp(n,rate=l1)
c1<-runif(n,0,10)
s2<-rexp(n,rate=l2)
c2<-runif(n,0,10)
s3<-rexp(n,rate=l3)
c3<-runif(n,0,10)

t1 = pmin(s1,c1)
t2 = pmin(s2,c2)
t3 = pmin(s3,c3)

event = c((t1==s1),(t2==s2),(t3==s3))
time = c(t1,t2,t3)
survdat = cbind(time, event)
rownames(survdat) = rnames
#survfit(Surv(time,event) ~ truth)
plot(survfit(Surv(time,event) ~ truth), lty=1:3, mark.time=T, bty="l",lwd=1.5, main="simulated survival dataset")
Then we can run cv.survclust from k=2-5 for 10 rounds of 3-fold cross
validation to see how we perform.
registerDoParallel(cores=4)
cvrounds<-function(x,survdat,kk){
    this.fold=3
    fit<-list()
    for (i in 1:10){
        fit[[i]] = cv.survclust(x, survdat,kk,this.fold)
    }
    print(paste0("finished ", this.fold, " rounds for k= ", kk))
    return(fit)
}

ptm <- proc.time()
cv.fit<-foreach(kk=2:5) %dopar% cvrounds(x,survdat,kk)
After cv.survclust move on to consensus.summary to aggregate
results over cross validation rounds, pick k and arrive at
consolidated test labels.
We see how logrank statistic is maximized at k=3 and Standardized Pooled Within Sum of Square Statistic (SPWSS) is elbow-ed at k=3 as well.
#kk = k-1, or 5-1
#cvr = rounds of cross-validation

#this outputs 3 metrics - logrank, standardized pooled within-cluster sum of squares an dsolutions that have less than 5 samples in each k
sim.stats = getstats(cv.fit,kk=4, cvr=10)

#plotting the statistics from getstats() in a boxplot and line plot
plotstats(sim.stats, labels=2:5, col="indianred2", cex.axis=1.5, cex.lab=1.5)

#consolidated solutio label for optimal k
dd = getDist(x,survdat)
cv.labels = consensus.summary(3,dd, cv.fit, survdat, bty="l")
## performing consensus on 10 rounds
[1] “cross validated labels:” cv.labels 1 2 3 49 51 50

print(kable(table(cv.labels, truth), "html", caption="cross validated labels vs truth", row.names =TRUE) %>%
      kable_styling(bootstrap_options = "striped", full_width = F,position="left"))
cross validated labels vs truth
|
1 |
2 |
3 |
|
|---|---|---|---|
|
1 |
0 |
49 |
0 |
|
2 |
0 |
1 |
50 |
|
3 |
50 |
0 |
0 |
#compute distances (unweighted) between samples
kdd = as.matrix(dist(x[[1]], method="euclidean"))

#project them in multidimension space via cmdscale
kcmd.mat = cmdscale(kdd, nrow(kdd)-1)

#cluster using k-means
kmeans.soln = kmeans(kcmd.mat,3,nstart=100)

#plot cross tabulation between the truth and k=3 of kmeans
print(kable(table(kmeans.soln$cluster, truth), "html", caption="k-means solution vs truth", row.names = TRUE) %>%
      kable_styling(bootstrap_options = "striped", full_width = F,position="left"))
k-means solution vs truth
|
1 |
2 |
3 |
|
|---|---|---|---|
|
1 |
15 |
24 |
16 |
|
2 |
0 |
6 |
34 |
|
3 |
35 |
20 |
0 |
dd = getDist(x,survdat)Where, x = a list of matrices of data types with samples as rows and
features as columns. survdat = a matrix of two columns where first
column is the reported time and second column are the events. Rows are
samples.
cc = combineDist(dd)
