install.packages("devtools")
devtools::install_github("jleechung/qeval")library(qeval)
library(SummarizedExperiment)
library(ggplot2)
library(gridExtra)Inputs path to files and their corresponding methods:
gtf <- list.files(system.file('extdata', package = 'qeval'), full.names = TRUE, pattern = 'rds')
path <- list.files(system.file('extdata', package = 'qeval'), full.names = TRUE, pattern = 'test_data')
list.files(path)
#> [1] "WTC11_cDNA_ONT_bambu.tsv"      "WTC11_cDNA_ONT_nanocount.tsv"
#> [3] "WTC11_cDNA_ONT_salmon.tsv"     "WTC11_cDNA_ONT_stringtie2.tsv"
methods <- c('bambu', 'nanocount', 'salmon', 'stringtie')
se <- constructSE(path, methods)
#> Reading 4 files
#> Found duplicate rows in file C:/Users/josep/OneDrive/Documents/R/win-library/4.0/qeval/extdata/test_data/WTC11_cDNA_ONT_stringtie2.tsv
#> Duplicated IDs: ENST00000431116.2, ENST00000432924.2, ENST00000435269.1
#> Taking mean of duplicated entries
#> Merge assays
#> Constructing summarized experiment
Annotate the summarized experiment:
gtf <- readRDS(gtf)
se <- annotateSE(se, gtf)
se
#> class: SummarizedExperiment
#> dim: 239225 12
#> metadata(0):
#> assays(1): values
#> rownames(239225): DQ459412 DQ459413 ... tx.998 tx.999
#> rowData names(3): tx.id num.exons length
#> colnames(12): ENCFF263YFG_bambu ENCFF023EXJ_bambu ...
#>   ENCFF023EXJ_stringtie ENCFF961HLO_stringtie
#> colData names(6): ID method ... nonzero files
For convenience:
cdata <- colData(se)
sample_bambu <- cdata$ID[cdata$method == 'bambu']
sample_nanocount <- cdata$ID[cdata$method == 'nanocount']
sample_salmon <- cdata$ID[cdata$method == 'salmon']
sample_stringtie <- cdata$ID[cdata$method == 'stringtie']plotHistogram(se, sample_bambu)
#> Warning in `[.data.table`(values, , ..samples): Both 'samples' and '..samples'
#> exist in calling scope. Please remove the '..samples' variable in calling scope
#> for clarity.
#> `stat_bin()` using `bins = 30`. Pick better value with `binwidth`.We subset to spike-in data:
features <- rownames(se)[!grepl('^ENST', rownames(se))] ## Spike-insDraw scatter plots with Spearman correlation between bambu and stringtie:
rowData(se)$log.length <- log10(rowData(se)$length + 1) ## Add log-length to row data
p1 <- plotScatter(se, sample_bambu[1], sample_stringtie[1], features = features)
p2 <- plotScatter(se, sample_bambu[1], sample_stringtie[1], density = T, features = features)
p3 <- plotScatter(se, sample_bambu[1], sample_stringtie[1], density = F, features = features, annotate = 'num.exons')
p4 <- plotScatter(se, sample_bambu[1], sample_stringtie[1], density = F, features = features, annotate = 'log.length')
grid.arrange(p1, p2, p3, p4, nrow = 2, ncol = 2)features <- rownames(se)[!grepl('^ENST', rownames(se))] ## Spike-ins
samples <- colnames(se)
sample <- sample_bambu ## bambu
reference <- sample_stringtie ## use stringtie as a baseline for comparisonAbundance recovery rate:
ARR <- computeRecovery(se, sample, reference, features = features)
ARR$metrics
#> ENCFF263YFG_bambu ENCFF023EXJ_bambu ENCFF961HLO_bambu
#>         0.5446095         0.5233675         0.7388389
ARR$plot + geom_hline(yintercept = 1, linetype = 'dashed', color = 2)
Relative difference:
RD <- computeDifference(se, sample, reference, features = features)
RD$metrics
#> ENCFF263YFG_bambu ENCFF023EXJ_bambu ENCFF961HLO_bambu
#>         0.4553905         0.4766325         0.3329107
RD$plot
Normalized root mean squared error:
computeNRMSE(se, sample, reference, features = features)
#> ENCFF263YFG_bambu ENCFF023EXJ_bambu ENCFF961HLO_bambu
#> 0.7812280 0.8013901 0.7932782Reproducibility:
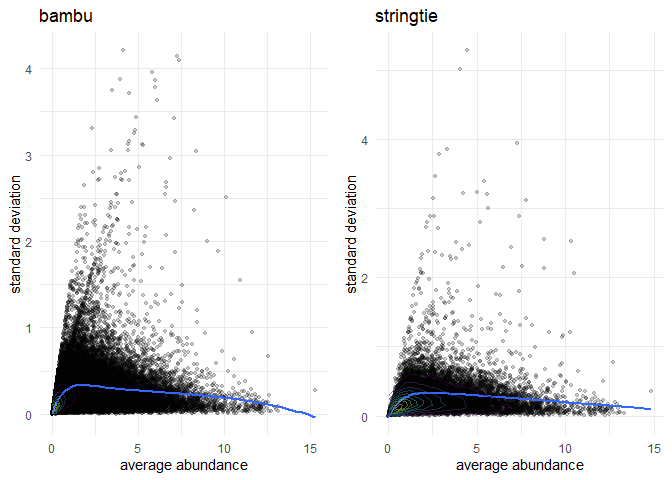
rep1 <- computeReproducibility(se, sample_bambu, pt.alpha = 0.2)
#> Warning in `[.data.table`(values, , ..samples): Both 'samples' and '..samples'
#> exist in calling scope. Please remove the '..samples' variable in calling scope
#> for clarity.
rep1$metric
#> [1] 0.3247098
r1 <- rep1$plot + labs(title = 'bambu')

rep2 <- computeReproducibility(se, sample_stringtie, pt.alpha = 0.2)
#> Warning in `[.data.table`(values, , ..samples): Both 'samples' and '..samples'
#> exist in calling scope. Please remove the '..samples' variable in calling scope
#> for clarity.
rep2$metric
#> [1] 0.3790168
r2 <- rep2$plot + labs(title = 'stringtie')

grid.arrange(r1, r2, ncol = 2)
Consistency:
samples <- c(sample_bambu, sample_stringtie)
computeConsistency(se, samples)
#> Warning in `[.data.table`(values, , ..samples): Both 'samples' and '..samples'
#> exist in calling scope. Please remove the '..samples' variable in calling scope
#> for clarity.
#> Warning in `[.data.table`(values, , ..keep): Both 'keep' and '..keep' exist in
#> calling scope. Please remove the '..keep' variable in calling scope for clarity.

#> Warning in `[.data.table`(values, , ..keep): Both 'keep' and '..keep' exist in
#> calling scope. Please remove the '..keep' variable in calling scope for clarity.
#> $plot
#>
#> $metric
#> $metric$bambu
#> threshold=0 threshold=0.1 threshold=0.2 threshold=0.3 threshold=0.4
#> 1.0000000 0.9744643 0.9640179 0.9515179 0.9450000
#> threshold=0.5 threshold=0.6 threshold=0.7 threshold=0.8 threshold=0.9
#> 0.9384821 0.9317857 0.9266964 0.9216964 0.9162500
#> threshold=1 threshold=1.1 threshold=1.2 threshold=1.3 threshold=1.4
#> 0.9111607 0.9082143 0.9076786 0.9072321 0.9012500
#> threshold=1.5 threshold=1.6 threshold=1.7 threshold=1.8 threshold=1.9
#> 0.8997321 0.9016071 0.9008036 0.9008929 0.8995536
#> threshold=2
#> 0.8991071
#>
#> $metric$stringtie
#> threshold=0 threshold=0.1 threshold=0.2 threshold=0.3 threshold=0.4
#> 1.0000000 0.9880357 0.9591964 0.9349107 0.9156250
#> threshold=0.5 threshold=0.6 threshold=0.7 threshold=0.8 threshold=0.9
#> 0.9027679 0.8931250 0.8908929 0.8886607 0.8871429
#> threshold=1 threshold=1.1 threshold=1.2 threshold=1.3 threshold=1.4
#> 0.8832143 0.8841964 0.8844643 0.8819643 0.8840179
#> threshold=1.5 threshold=1.6 threshold=1.7 threshold=1.8 threshold=1.9
#> 0.8850893 0.8878571 0.8884821 0.8895536 0.8940179
#> threshold=2
#> 0.8967857
Resolution entropy:
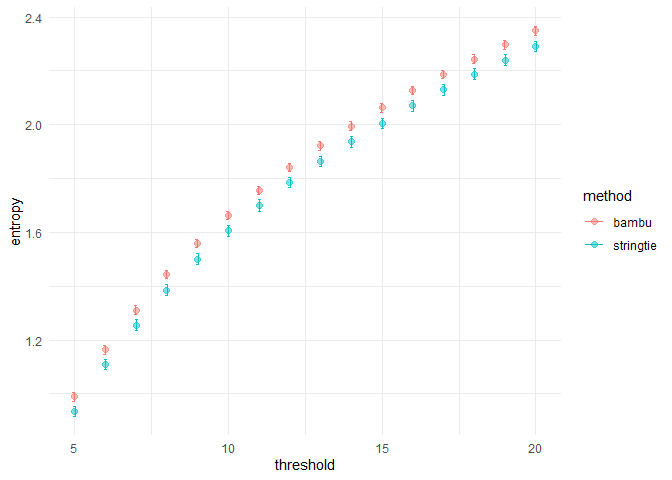
samples <- c(sample_bambu, sample_stringtie)
computeResEntropy(se, samples)
#> Warning in `[.data.table`(values, , ..samples): Both 'samples' and '..samples'
#> exist in calling scope. Please remove the '..samples' variable in calling scope
#> for clarity.
#> Warning in `[.data.table`(values, , ..keep): Both 'keep' and '..keep' exist in
#> calling scope. Please remove the '..keep' variable in calling scope for clarity.

#> Warning in `[.data.table`(values, , ..keep): Both 'keep' and '..keep' exist in
#> calling scope. Please remove the '..keep' variable in calling scope for clarity.
#> $plot
#>
#> $metric
#> $metric$bambu
#> nbin=5 nbin=6 nbin=7 nbin=8 nbin=9 nbin=10 nbin=11 nbin=12
#> 0.9803292 1.1556703 1.3035150 1.4341568 1.5511848 1.6538753 1.7484518 1.8326309
#> nbin=13 nbin=14 nbin=15 nbin=16 nbin=17 nbin=18 nbin=19 nbin=20
#> 1.9128475 1.9860879 2.0538298 2.1181634 2.1782012 2.2363300 2.2892213 2.3399609
#>
#> $metric$stringtie
#> nbin=5 nbin=6 nbin=7 nbin=8 nbin=9 nbin=10 nbin=11 nbin=12
#> 0.9300518 1.1019286 1.2505439 1.3796928 1.4946449 1.5993542 1.6930902 1.7808875
#> nbin=13 nbin=14 nbin=15 nbin=16 nbin=17 nbin=18 nbin=19 nbin=20
#> 1.8588336 1.9299735 1.9991827 2.0640776 2.1233931 2.1813173 2.2347597 2.2847165
sessionInfo()
#> R version 4.0.3 (2020-10-10)
#> Platform: x86_64-w64-mingw32/x64 (64-bit)
#> Running under: Windows 10 x64 (build 19043)
#>
#> Matrix products: default
#>
#> locale:
#> [1] LC_COLLATE=English_Singapore.1252  LC_CTYPE=English_Singapore.1252
#> [3] LC_MONETARY=English_Singapore.1252 LC_NUMERIC=C
#> [5] LC_TIME=English_Singapore.1252
#>
#> attached base packages:
#> [1] parallel  stats4    stats     graphics  grDevices utils     datasets
#> [8] methods   base
#>
#> other attached packages:
#>  [1] gridExtra_2.3               ggplot2_3.3.5
#>  [3] SummarizedExperiment_1.20.0 Biobase_2.50.0
#>  [5] GenomicRanges_1.42.0        GenomeInfoDb_1.26.7
#>  [7] IRanges_2.24.1              S4Vectors_0.28.1
#>  [9] BiocGenerics_0.36.1         MatrixGenerics_1.2.1
#> [11] matrixStats_0.60.0          qeval_0.0.0.9000
#>
#> loaded via a namespace (and not attached):
#>  [1] tidyselect_1.1.1       xfun_0.25              purrr_0.3.4
#>  [4] splines_4.0.3          lattice_0.20-41        colorspace_2.0-2
#>  [7] vctrs_0.3.8            generics_0.1.0         viridisLite_0.4.0
#> [10] htmltools_0.5.2        mgcv_1.8-33            yaml_2.2.1
#> [13] utf8_1.2.2             rlang_0.4.11           isoband_0.2.5
#> [16] pillar_1.6.3           glue_1.4.2             withr_2.4.2
#> [19] DBI_1.1.1              GenomeInfoDbData_1.2.4 lifecycle_1.0.1
#> [22] stringr_1.4.0          zlibbioc_1.36.0        munsell_0.5.0
#> [25] gtable_0.3.0           evaluate_0.14          labeling_0.4.2
#> [28] knitr_1.36             fastmap_1.1.0          fansi_0.5.0
#> [31] highr_0.9              scales_1.1.1           DelayedArray_0.16.3
#> [34] XVector_0.30.0         farver_2.1.0           digest_0.6.28
#> [37] stringi_1.7.3          dplyr_1.0.7            grid_4.0.3
#> [40] tools_4.0.3            bitops_1.0-7           magrittr_2.0.1
#> [43] RCurl_1.98-1.3         tibble_3.1.3           crayon_1.4.1
#> [46] pkgconfig_2.0.3        MASS_7.3-53            ellipsis_0.3.2
#> [49] Matrix_1.3-4           data.table_1.14.0      assertthat_0.2.1
#> [52] rmarkdown_2.11         R6_2.5.1               nlme_3.1-149
#> [55] compiler_4.0.3


