Kimera-VIO: Open-Source Visual Inertial Odometry
For evaluation plots, check our jenkins server.
Authors: Antoni Rosinol, Yun Chang, Marcus Abate, Sandro Berchier, Luca Carlone
What is Kimera-VIO?
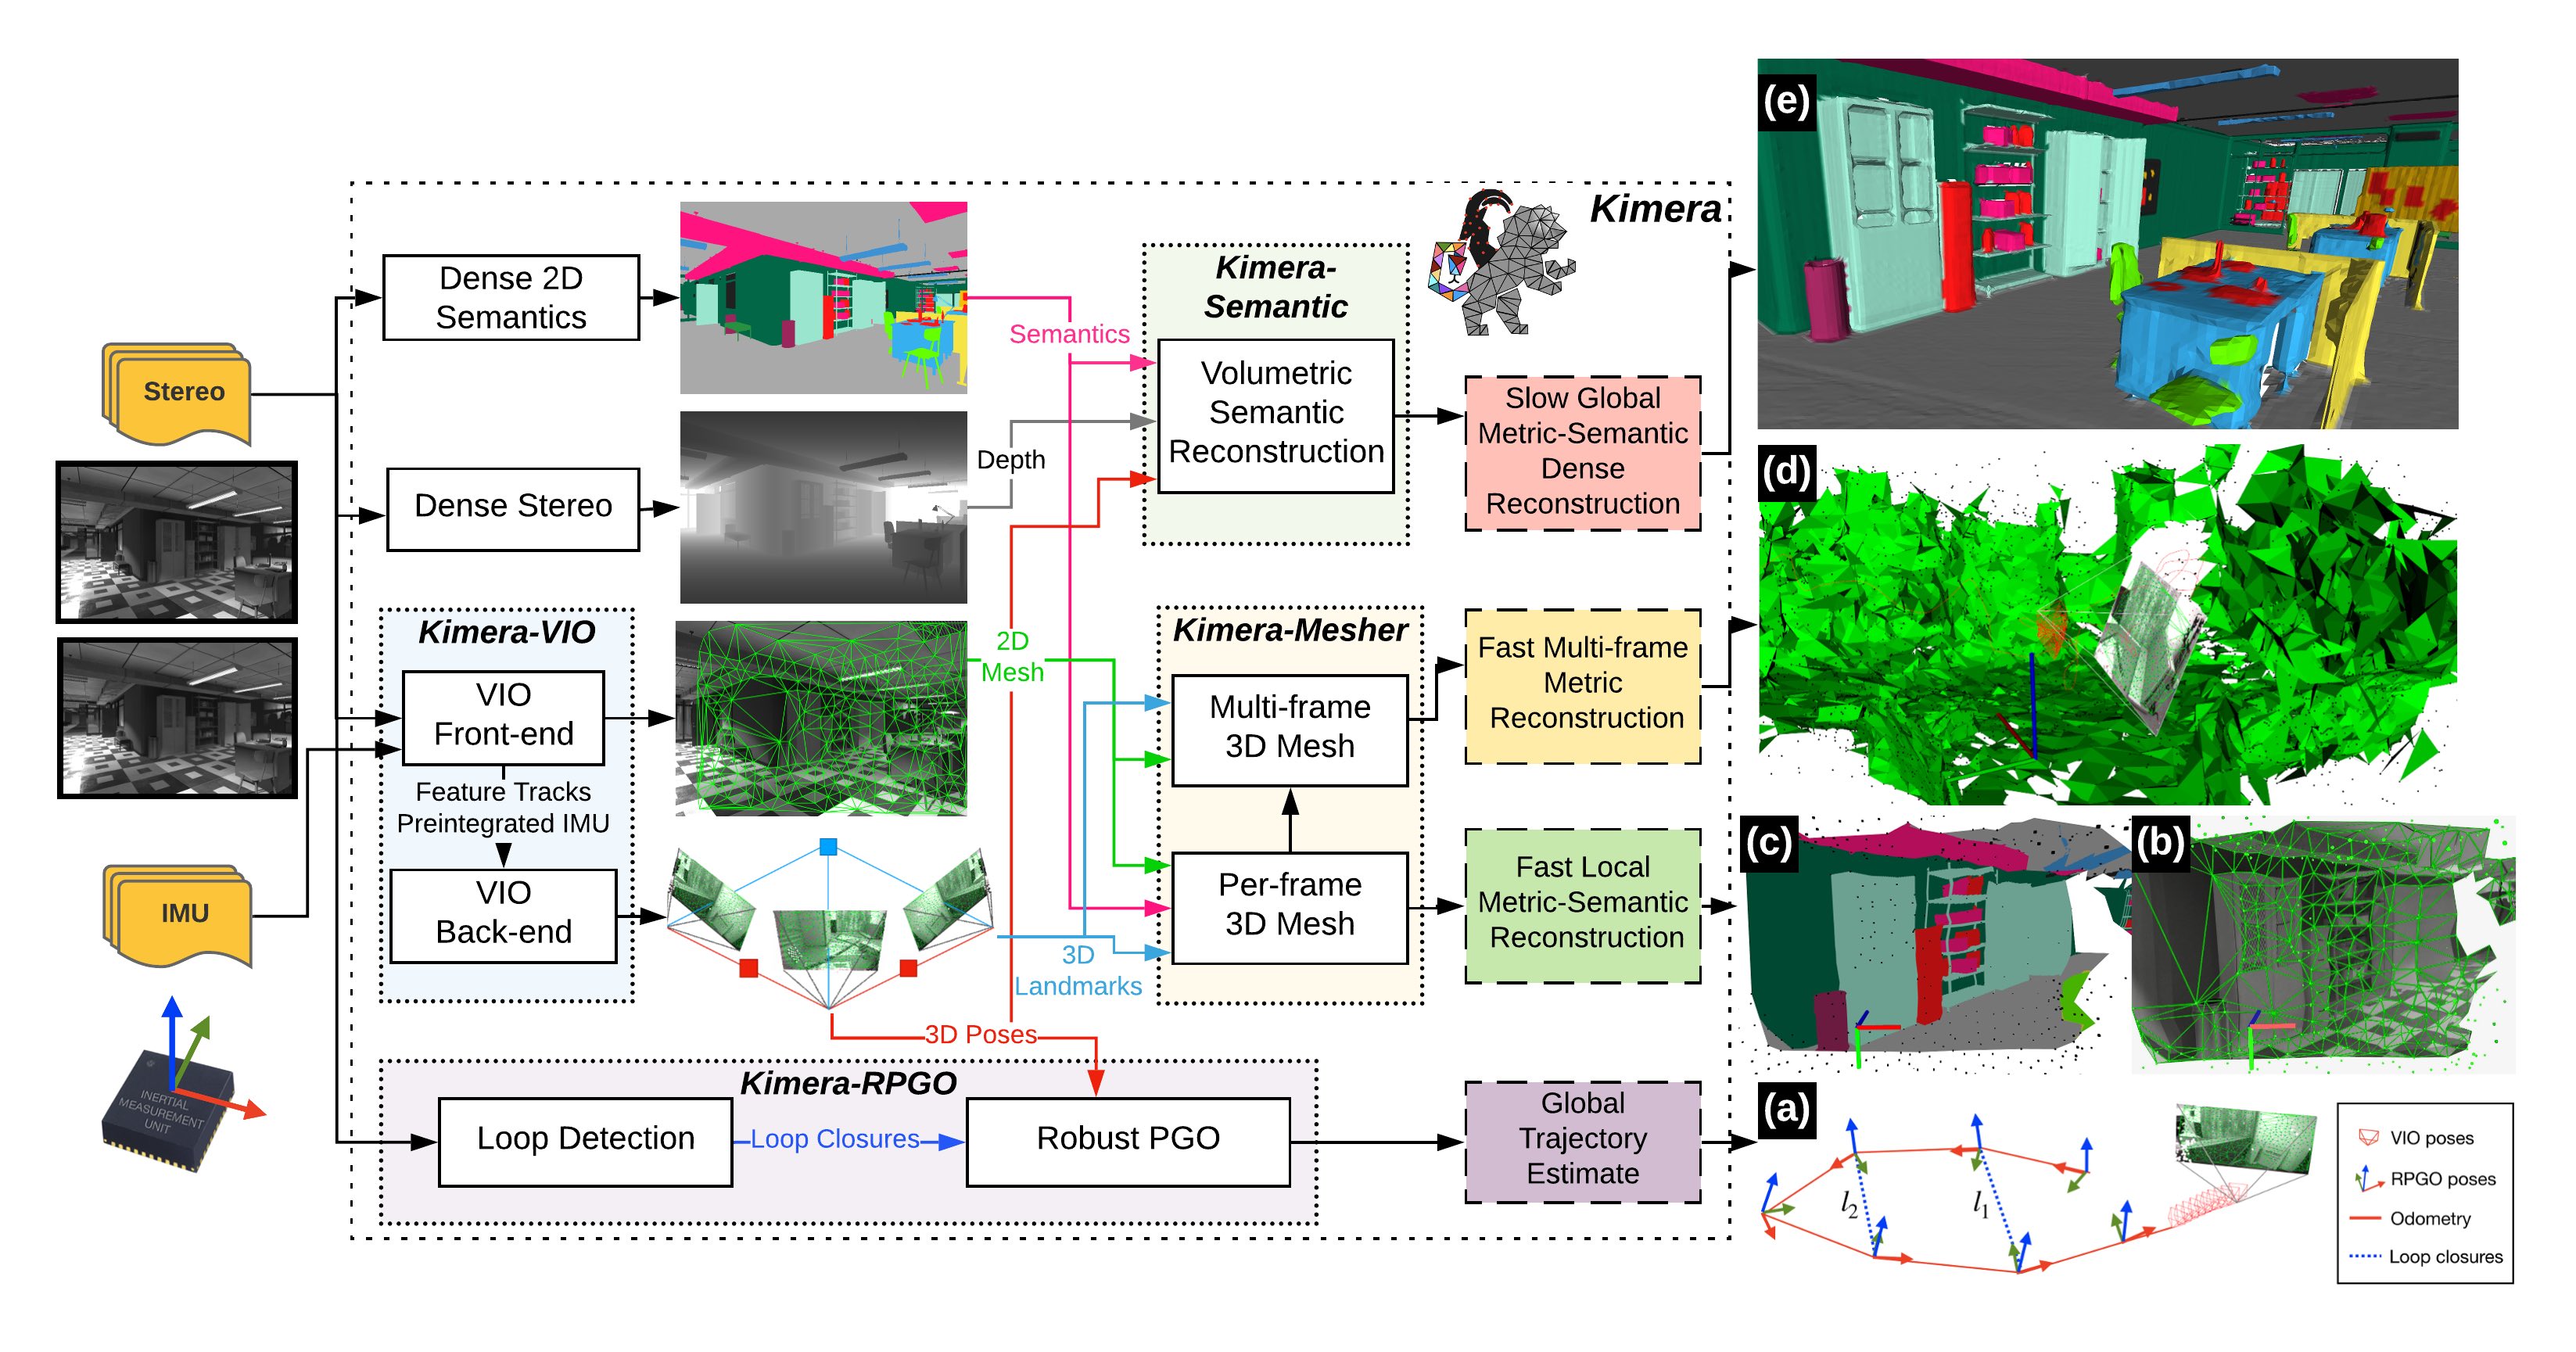
Kimera-VIO is a Visual Inertial Odometry pipeline for accurate State Estimation from Stereo + IMU data.
Publications
We kindly ask to cite our paper if you find this library useful:
- A. Rosinol, M. Abate, Y. Chang, L. Carlone, Kimera: an Open-Source Library for Real-Time Metric-Semantic Localization and Mapping. IEEE Intl. Conf. on Robotics and Automation (ICRA), 2020. arXiv:1910.02490.
@InProceedings{Rosinol20icra-Kimera,
  title = {Kimera: an Open-Source Library for Real-Time Metric-Semantic Localization and Mapping},
  author = {Rosinol, Antoni and Abate, Marcus and Chang, Yun and Carlone, Luca},
  year = {2020},
  booktitle = {IEEE Intl. Conf. on Robotics and Automation (ICRA)},
  url = {https://github.com/MIT-SPARK/Kimera},
  pdf = {https://arxiv.org/pdf/1910.02490.pdf}
}
Related Publications
Backend optimization is based on:
-
C. Forster, L. Carlone, F. Dellaert, and D. Scaramuzza. On-Manifold Preintegration Theory for Fast and Accurate Visual-Inertial Navigation. IEEE Trans. Robotics, 33(1):1-21, 2016.
-
L. Carlone, Z. Kira, C. Beall, V. Indelman, and F. Dellaert. Eliminating Conditionally Independent Sets in Factor Graphs: A Unifying Perspective based on Smart Factors. IEEE Intl. Conf. on Robotics and Automation (ICRA), 2014.
Alternatively, the Regular VIO backend, using structural regularities, is described in this paper:
- A. Rosinol, T. Sattler, M. Pollefeys, and L. Carlone. Incremental Visual-Inertial 3D Mesh Generation with Structural Regularities. IEEE Int. Conf. on Robotics and Automation (ICRA), 2019.
Demo
1. Installation
Tested on Mac, Ubuntu 14.04 & 16.04 & 18.04.
Prerequisites
- GTSAM >= 4.0
- OpenCV >= 3.3.1
- OpenGV
- Glog, Gflags
- Gtest (installed automagically).
- DBoW2
- Kimera-RPGO
- ANMS (source files in
src/frontend/feature-detector/anms, used for adaptive non-max suppression).
Note: if you want to avoid building all dependencies yourself, we provide a docker image that will install them for you. Check installation instructions in docs/kimera_vio_install.md.
Note 2: if you use ROS, then Kimera-VIO-ROS can install all dependencies and Kimera inside a catkin workspace.
Installation Instructions
Find how to install Kimera-VIO and its dependencies here: Installation instructions.
2. Usage
General tips
The LoopClosureDetector (and PGO) module is disabled by default. If you wish to run the pipeline with loop-closure detection enabled, set the use_lcd flag to true. For the example script, this is done by passing -lcd at commandline like so:
./scripts/stereoVIOEUROC.bash -lcdTo log output, set the log_output flag to true. For the script, this is done with the -log commandline argument. By default, log files will be saved in output_logs.
To run the pipeline in sequential mode (one thread only), set parallel_runto false. This can be done in the example script with the -s argument at commandline.
i. Euroc Dataset
Download Euroc's dataset
- Download one of Euroc's datasets, for example V1_01_easy.zip.
Datasets MH_04 and V2_03 have different number of left/right frames. We suggest using instead our version of Euroc here.
- Unzip the dataset to your preferred directory, for example, in
~/Euroc/V1_01_easy:
mkdir -p ~/Euroc/V1_01_easy
unzip -o ~/Downloads/V1_01_easy.zip -d ~/Euroc/V1_01_easy
Yamelize Euroc's dataset
Add %YAML:1.0 at the top of each .yaml file inside Euroc.
You can do this manually or run the yamelize.bash script by indicating where the dataset is (it is assumed below to be in ~/path/to/euroc):
You don't need to yamelize the dataset if you download our version here
cd Kimera-VIO
bash ./scripts/euroc/yamelize.bash -p ~/path/to/euroc
Run Kimera-VIO in Euroc's dataset
Using a bash script bundling all command-line options and gflags:
cd Kimera-VIO
bash ./scripts/stereoVIOEuroc.bash -p "PATH_TO_DATASET/V1_01_easy"
Alternatively, one may directly use the executable in the build folder:
./build/stereoVIOEuroc. Nevertheless, check the script./scripts/stereoVIOEuroc.bashto understand what parameters are expected, or check the parameters section below.
ii. Using ROS wrapper
We provide a ROS wrapper of Kimera-VIO that you can find at: https://github.com/MIT-SPARK/Kimera-VIO-ROS.
This library can be cloned into a catkin workspace and built alongside the ROS wrapper.
iii. Evaluation and Debugging
For more information on tools for debugging and evaluating the pipeline, see our documentation
iv. Unit Testing
We use gtest for unit testing.
To run the unit tests: build the code, navigate inside the build folder and run testKimeraVIO:
cd build
./testKimeraVIO
A useful flag is ./testKimeraVIO --gtest_filter=foo to only run the test you are interested in (regex is also valid).
3. Parameters
Kimera-VIO accepts two independent sources of parameters:
- YAML files: contains parameters for Backend and Frontend.
- gflags contains parameters for all the rest.
To get help on what each gflag parameter does, just run the executable with the --help flag: ./build/stereoVIOEuroc --help. You should get a list of gflags similar to the ones here.
- Optionally, you can try the VIO using structural regularities, as in our ICRA 2019 paper, by specifying the option
-r:./stereoVIOEuroc.bash -p "PATH_TO_DATASET/V1_01_easy" -r
OpenCV's 3D visualization also has some shortcuts for interaction: check tips for usage
4. Contribution guidelines
We strongly encourage you to submit issues, feedback and potential improvements. We follow the branch, open PR, review, and merge workflow.
To contribute to this repo, ensure your commits pass the linter pre-commit checks.
To enable these checks you will need to install linter.
We also provide a .clang-format file with the style rules that the repo uses, so that you can use clang-format to reformat your code.
Also, check tips for development and our developer guide.
5. FAQ
Issues
If you have problems building or running the pipeline and/or issues with dependencies, you might find useful information in our FAQ or in the issue tracker.
How to interpret console output
I0512 21:05:55.136549 21233 Pipeline.cpp:449] Statistics
-----------                                  #	Log Hz	{avg     +- std    }	[min,max]
Data Provider [ms]                      	    0
Display [ms]                            	  146	36.5421	{8.28082 +- 2.40370}	[3,213]
VioBackEnd [ms]                         	   73	19.4868	{15.2192 +- 9.75712}	[0,39]
VioFrontEnd Frame Rate [ms]             	  222	59.3276	{5.77027 +- 1.51571}	[3,12]
VioFrontEnd Keyframe Rate [ms]          	   73	19.6235	{31.4110 +- 7.29504}	[24,62]
VioFrontEnd [ms]                        	  295	77.9727	{12.1593 +- 10.7279}	[3,62]
Visualizer [ms]                         	   73	19.4639	{3.82192 +- 0.805234}	[2,7]
backend_input_queue Size [#]            	   73	18.3878	{1.00000 +- 0.00000}	[1,1]
data_provider_left_frame_queue Size (#) 	  663	165.202	{182.265 +- 14.5110}	[1,359]
data_provider_right_frame_queue Size (#)	  663	165.084	{182.029 +- 14.5150}	[1,359]
display_input_queue Size [#]            	  146	36.5428	{1.68493 +- 0.00000}	[1,12]
stereo_frontend_input_queue Size [#]    	  301	75.3519	{4.84718 +- 0.219043}	[1,5]
visualizer_backend_queue Size [#]       	   73	18.3208	{1.00000 +- 0.00000}	[1,1]
visualizer_frontend_queue Size [#]      	  295	73.9984	{4.21695 +- 1.24381}	[1,7]
#number of samples taken.Log Hzaverage number of samples taken per second in Hz.avgaverage of the actual value logged. Same unit as the logged quantity.stdstandard deviation of the value logged.[min,max]minimum and maximum values that the logged value took.
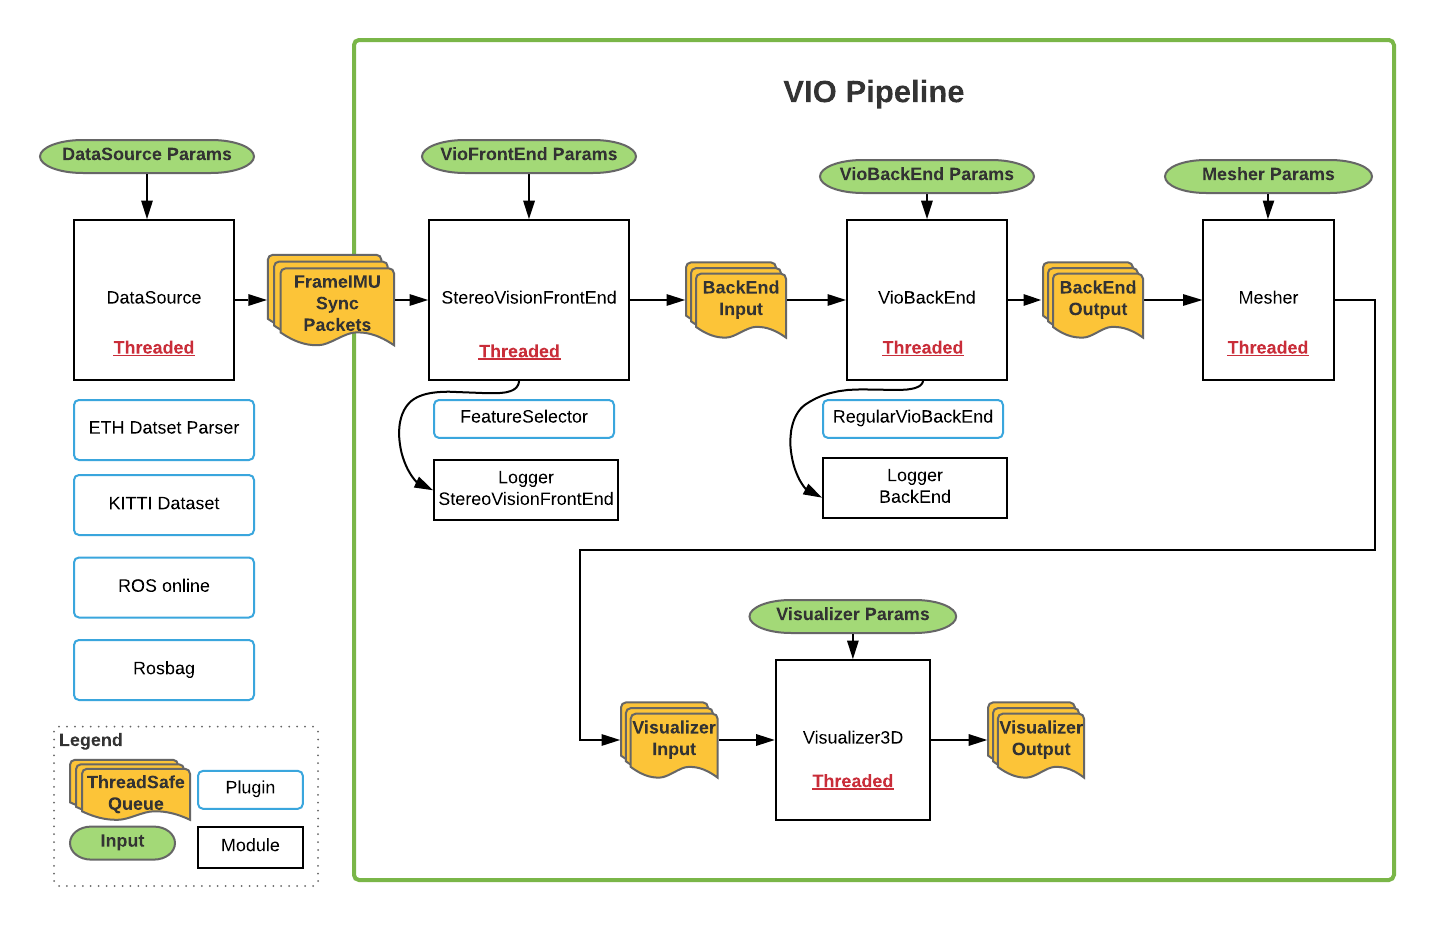
There are two main things logged: the time it takes for the pipeline modules to run (i.e. VioBackEnd, Visualizer etc), and the size of the queues between pipeline modules (i.e. backend_input_queue).
For example:
VioBackEnd [ms] 73 19.4868 {15.2192 +- 9.75712} [0,39]
Shows that the backend runtime got sampled 73 times, at a rate of 19.48Hz (which accounts for both the time the backend waits for input to consume and the time it takes to process it). That it takes 15.21ms to consume its input with a standard deviation of 9.75ms and that the least it took to run for one input was 0ms and the most it took so far is 39ms.
For the queues, for example:
stereo_frontend_input_queue Size [#] 301 75.3519 {4.84718 +- 0.219043} [1,5]
Shows that the frontend input queue got sampled 301 times, at a rate of 75.38Hz. That it stores an average of 4.84 elements, with a standard deviation of 0.21 elements, and that the min size it had was 1 element, and the max size it stored was of 5 elements.
6. Chart
7. BSD License
Kimera-VIO is open source under the BSD license, see the LICENSE.BSD file.


