metadata <- readxl::read_excel(here::here('data', 'GLNE07samples_baxter.xlsx'))
nrow(metadata)
#> [1] 757
metadata %>%
    group_by(Diagnosis) %>%
    summarize(n = n())
#> # A tibble: 6 x 2
#>   Diagnosis            n
#>   <chr>            <int>
#> 1 Adenoma            311
#> 2 Cancer             211
#> 3 High Risk Normal    64
#> 4 Normal             159
#> 5 Pending              7
#> 6 <NA>                 5

metadata %>%
    filter(Diagnosis != 'Pending', !is.na(Diagnosis)) %>%
    mutate(Diagnosis = recode(Diagnosis,
                              `High Risk Normal` = 'Normal')
           ) %>%
    group_by(Diagnosis) %>%
    summarize(n = n())
#> # A tibble: 3 x 2
#>   Diagnosis     n
#>   <chr>     <int>
#> 1 Adenoma     311
#> 2 Cancer      211
#> 3 Normal 223set.seed(2019)
plot_auroc <- function(mldata) {
mldata %>% ggplot(aes(model, auroc)) +
geom_boxplot(color = "slategray3", width = 0.3, lwd = 1, fatten = 1) +
geom_hline(yintercept = 0.5,
linetype = 'dashed',
color = 'slategray3') +
ylim(0.5, 1) +
labs(y = 'AUROC', x = 'Model Features') +
theme_classic(base_family = 'Chalkduster',
base_size = 18) +
theme(axis.ticks.x = element_line(colour=NA),
axis.line.x = element_blank(),
axis.line.y = element_line(color = "slategray3"),
text = element_text(color = 'darkslategray'),
axis.text = element_text(color = 'darkslategray'))
}data.frame(OTUs = rnorm(100, .69, .04),
pathways = rnorm(100, .79, .04),
both = rnorm(100, .82, .04)) %>%
pivot_longer(everything(), names_to = "model", values_to = 'auroc') %>%
filter(auroc < 1) %>%
mutate(model = as_factor(model) %>%
recode(both = 'OTUs + pathways')) %>%
plot_auroc()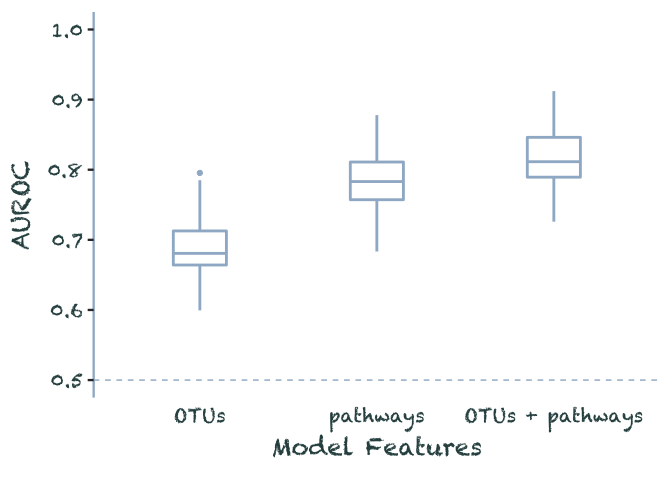
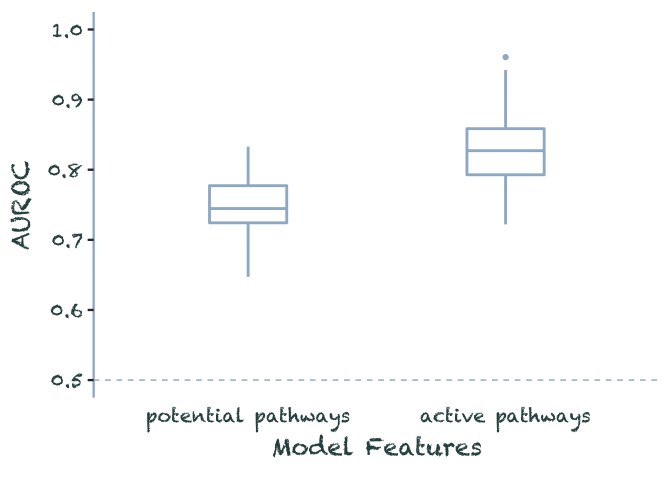
data.frame(potential_pathways = rnorm(100, .75, .04),
                  active_pathways = rnorm(100, .83, .04)) %>%
  pivot_longer(everything(), names_to = "model", values_to = 'auroc') %>%
  filter(auroc < 1) %>%
  mutate(model = as_factor(model) %>%
           recode(potential_pathways = 'potential pathways',
                  active_pathways = 'active pathways')) %>%
  plot_auroc()