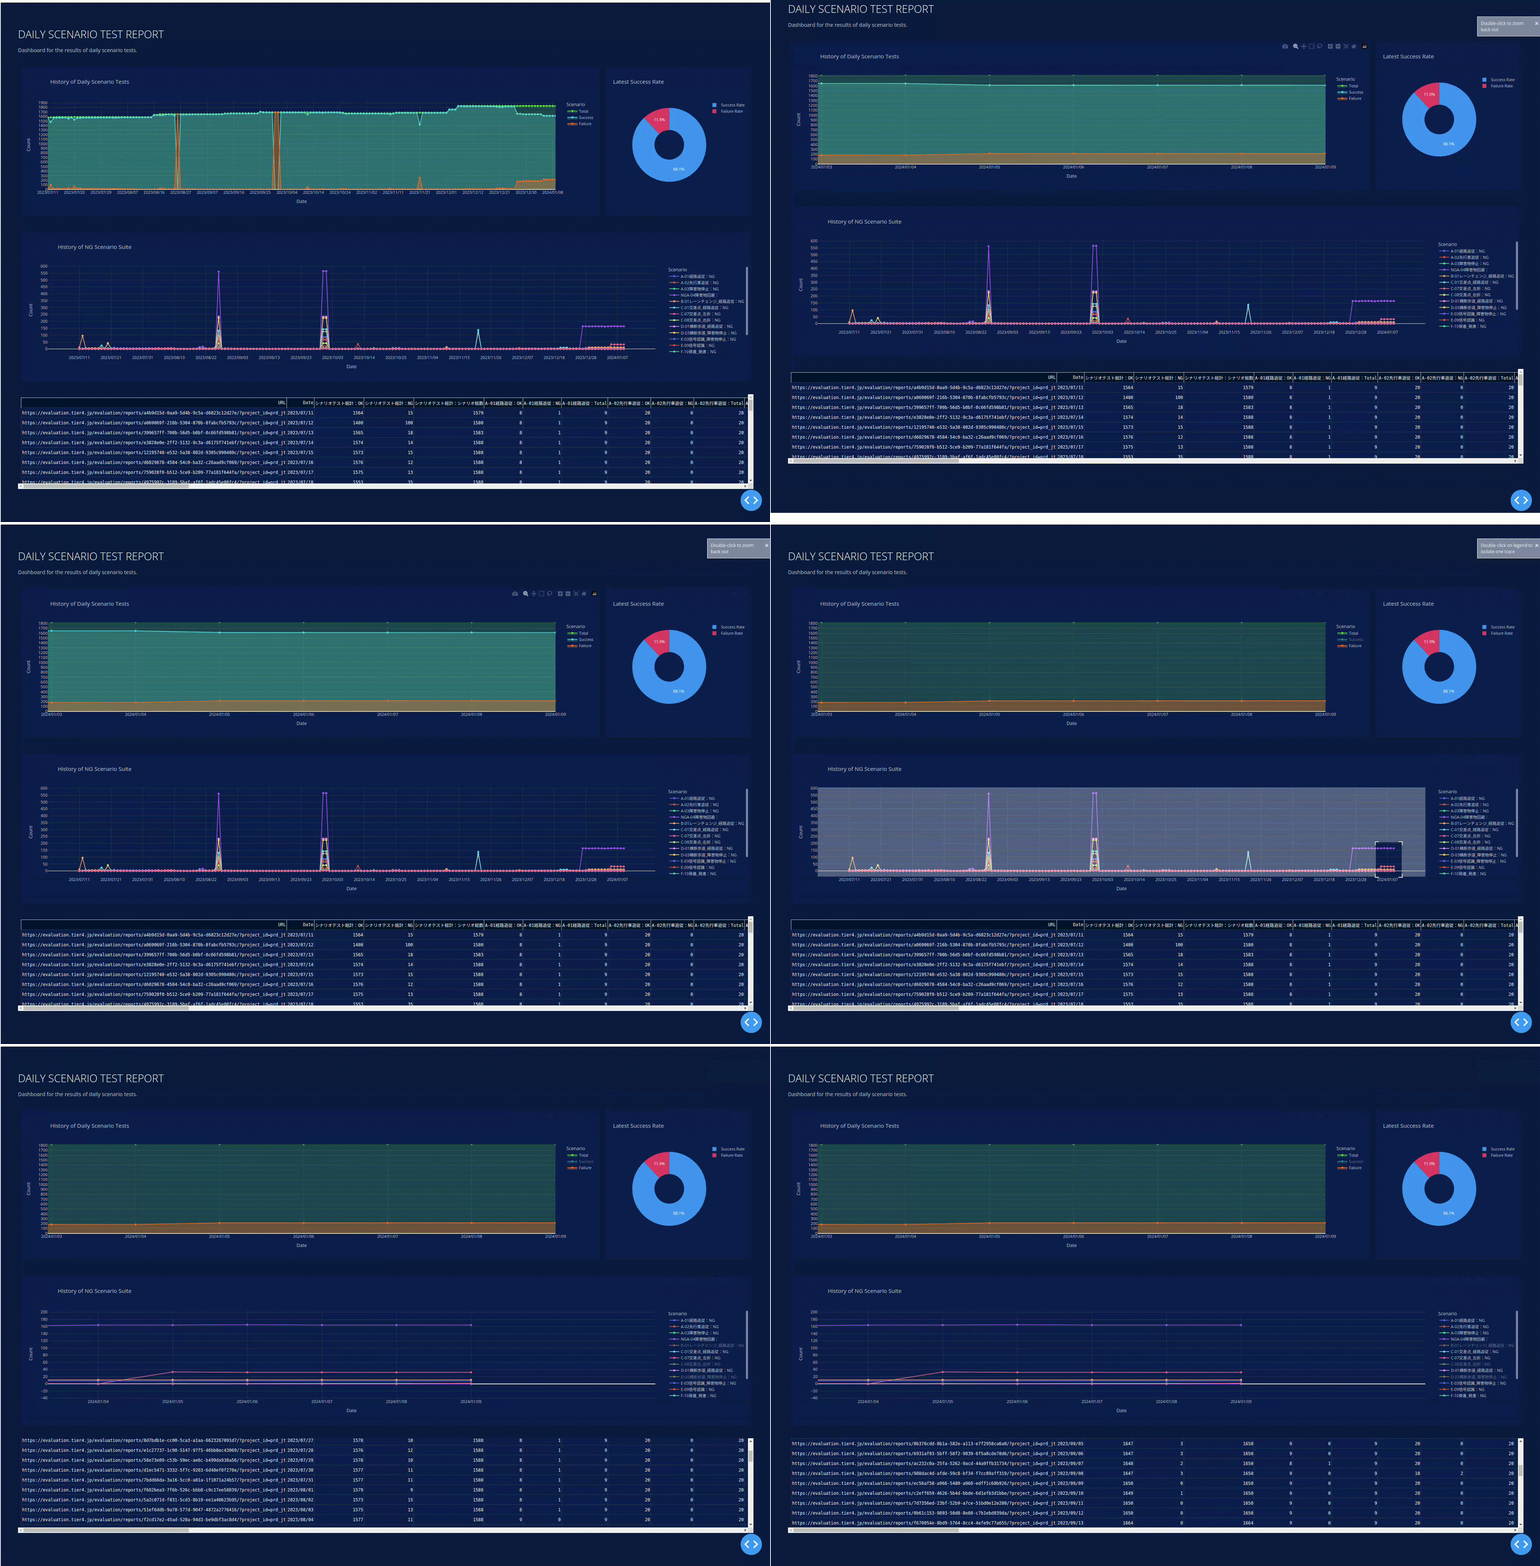
This dashboard is designed for visualizing the results of daily scenario tests. It includes features to check the success rate and the status of each use case in an interactive manner.
To run this dashboard on your local machine, you will need Python installed, along with the necessary packages.
pip install -r requirements.txtTo start the Dash app, run:
python3 daily_scenario_test/plotly_dash_daily_test.pyand access to the localhost url (probably http://127.0.0.1:8050/, see the message on the terminal you run this script on)
- Time Series Plot: Visualizes test results over time.
- Pie Chart: Shows the success rate of the latest test.
- NG Analysis Plot: Details the failure rates across different scenarios.
