clustifyR classifies cells and clusters in single-cell RNA sequencing experiments using reference bulk RNA-seq data sets, gene signatures, or marker genes.
Single cell transcriptomes are difficult to annotate without extensive knowledge of the underlying biology of the system in question. Even with this knowledge, accurate identification can be challenging due to the lack of detectable expression of common marker genes. ClustifyR solves this problem by automatically annotating single cells or clusters using bulk RNA-seq data or marker gene lists. Additional functions allow for exploratory analysis of similarities between single cell RNA-seq datasets and reference data.
# install.packages("devtools")
devtools::install_github("rnabioco/clustifyR")In this example we use the following input data:
- an expression matrix of single cell RNA-seq data (
pbmc4k_matrix) - a metadata data.frame (
pbmc4k_meta) - a vector of variable genes (
pbmc4k_vargenes)- - a matrix of bulk RNA-seq read counts (
pbmc_bulk_matrix):
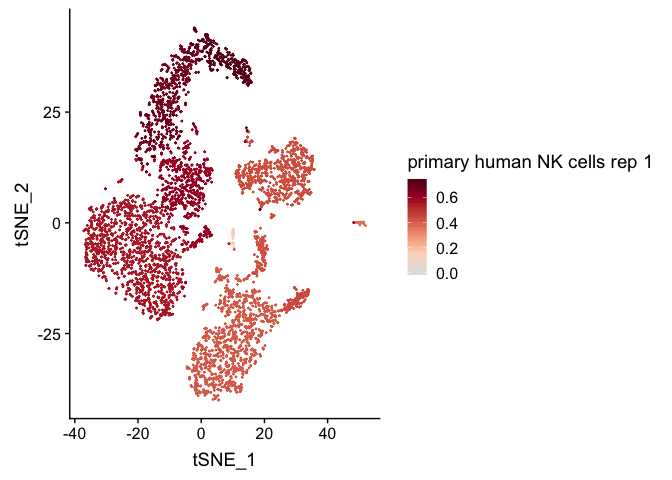
We then calculate correlation coefficients and plot them on a
pre-calculated tSNE projection (stored in pbmc4k_meta).
library(clustifyR)

res <- clustify(
  expr_mat = pbmc4k_matrix,
  metadata = pbmc4k_meta$cluster,
  bulk_mat = pbmc_bulk_matrix,
  query_genes = pbmc4k_vargenes
)

plot_cor(
  res,
  pbmc4k_meta,
  colnames(res)[c(1, 5)],
  cluster_col = "cluster"
)
#> [[1]]
#>
#> [[2]]


