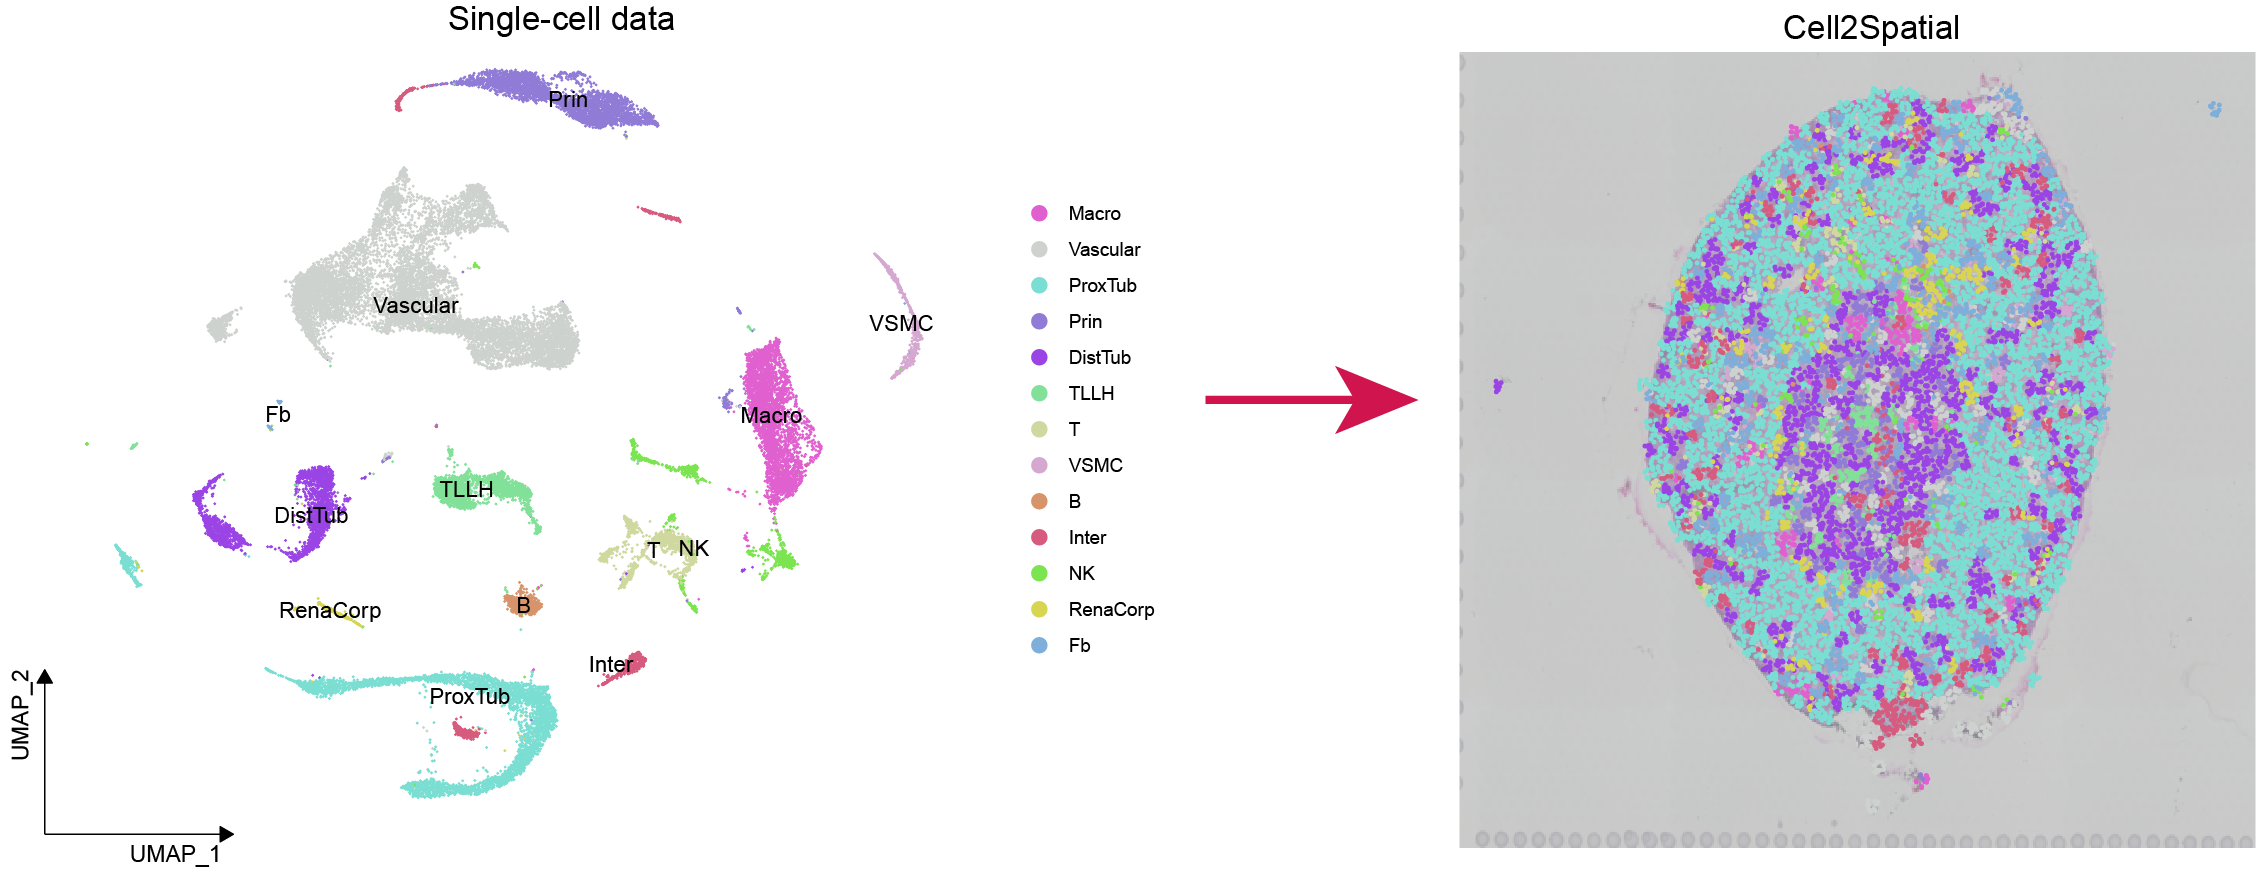
Cell2Spatial is a sophisticated tool specifically designed for decoding spatial transcriptomic spots at the individual cell level. Ensuring accurate alignment and maximizing practical applications necessitates a match in tissue origin or major cell type representation between single-cell and spatial transcriptomic data.
In this tutorial, we'll showcase the installation and usage of Cell2Spatial, allowing precise interpretation of spatial transcriptomic spots at a single-cell granularity.
The Cell2Spatial's code comprises both R and Python components, necessitating essential dependencies as following tables.
- Python (v3.8.17)
| Package | keras | lapjv | numpy | pandas | scikit_learn | tensorflow |
|---|---|---|---|---|---|---|
| Version | 2.13.1 | 1.3.24 | 1.24.3 | 2.0.3 | 1.3.2 | 2.13.1 |
- R (v4.4.1)
| Package | Seurat | SeuratObject | reticulate | sctransform | MatrixGenerics | UCell | glmGamPoi |
|---|---|---|---|---|---|---|---|
| Version | 4.3.0 | 4.1.3 | 1.38.0 | 0.4.1 | 1.16.0 | 2.8.0 | 1.16.0 |
(1). Python3 must be installed and configured in the environment for use with reticulate. Additionally, dependencies for Python libraries can be installed using the following command:
pip install -r requirements.txt
(2). Installing Cell2Spatial package
library(devtools)
install_github("lihuamei/Cell2Spatial")
- 10x Visium low-resolution spatial data of mouse kindney as an exmaple
library(Cell2Spatial)
library(Seurat)
library(dplyr)
library(tidydr)
library(randomcoloR)
sp.obj <- system.file("data", "Kindney_SP.RDS", package = "Cell2Spatial") %>% readRDS(.)
sc.obj <- system.file("data", "Kindney_SC.RDS", package = "Cell2Spatial") %>% readRDS(.)
sce <- runCell2Spatial(sp.obj, sc.obj, cell.type.column = "mainCtype", resolution = 0.8, fix.cells.in.spot = 10)
-
Cell Data Configuration: For low-resolution ST data, set
max.cells.in.spotto estimate cell count per spot, or usefix.cells.in.spotto observe cell type distribution more clearly. -
Non-matching Samples: Adjust
hotspot.detection.threshold(0-1, significance level 0.05) to detect cell-type-specific hot spots and filter unmatched spots. Set it to 1 for better visualization with perfectly matched samples.
sc.obj <- SCTransform(sc.obj, ncells = 3000, verbose = FALSE) %>% RunPCA(verbose = FALSE) %>% RunUMAP(dims = 1 : 30, verbose = FALSE)
cell.colors <- randomcoloR::distinctColorPalette(length(unique(sc.obj$mainCtype)))  %>% `names<-`(unique(sc.obj$mainCtype))
gp1 <- SpatialPlot(sce, group.by = 'Cell2Spatial', pt.size.factor=0.6, cols = cell.colors, image.alpha = 0.5, stroke = NA)
gp2 <- DimPlot(sc.obj, label = TRUE, cols = cell.colors) + theme_dr(xlength = 0.2, ylength = 0.2, arrow = grid::arrow(length = unit(0.1, "inches"), ends = 'last', type = "closed")) + theme(panel.grid = element_blank())
gp1 + gp2- Reformat ST data from various platforms to fit Cell2Spatial's requirements using the
createSpatialObjectfunction, an example as follows.
sp.obj <- createSpatialObject(counts, coord.df, coord.label = c("x", "y"), meta.data = meta.data)
# counts: Count matrix with genes as rows and spot barcodes as columns.
# coord.df: Data frame of spot coordinates, with row names representing spot barcodes.
# coord.label: Specify the coordinates informative column names keep in coord.df data.frame.- Assign single cells to spatial spots by setting
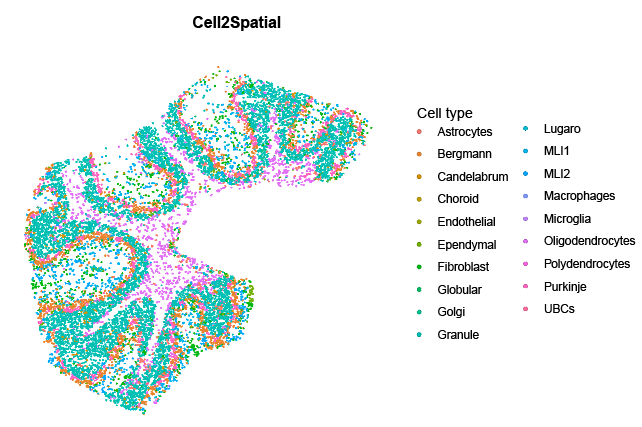
max.cells.in.spot = 1. For example, apply this to mouse cerebellum Slide-seq2 data (https://singlecell.broadinstitute.org/single_cell/study/SCP948).
sc.obj <- readRDS("your_path/cerebellum_SC.RDS")
sp.obj <- readRDS("your_path/cerebellum_ST.RDS")
sce <- runCell2Spatial(sp.obj, sc.obj, cell.type.column = "liger_ident_coarse", max.cells.in.spot = 1, signature.scoring.method = 'UCell', verbose = TRUE)
SpatialPlot(sce, group.by = 'Cell2Spatial', pt.size.factor = 1.0, stroke = NA)> sessionInfo()
R version 4.4.1 (2024-06-14)
Platform: x86_64-pc-linux-gnu
Running under: Ubuntu 22.04.2 LTS
Matrix products: default
BLAS: /usr/lib/x86_64-linux-gnu/openblas-pthread/libblas.so.3
LAPACK: /usr/lib/x86_64-linux-gnu/openblas-pthread/libopenblasp-r0.3.20.so; LAPACK version 3.10.0
locale:
[1] C
time zone: Asia/Chongqing
tzcode source: system (glibc)
attached base packages:
[1] stats graphics grDevices utils datasets methods base
other attached packages:
[1] Cell2Spatial_1.0.1 wrMisc_1.15.0.3 MuSiC_1.0.0
[4] TOAST_1.18.0 quadprog_1.5-8 limma_3.60.3
[7] EpiDISH_2.20.0 nnls_1.5 CARD_1.1
[10] Biobase_2.64.0 BiocGenerics_0.50.0 ggpubr_0.6.0
[13] reticulate_1.38.0 ggplot2_3.5.1 tidyr_1.3.1
[16] dplyr_1.1.4 SeuratObject_4.1.3 Seurat_4.3.0
[19] devtools_2.4.5 usethis_2.2.3
loaded via a namespace (and not attached):
[1] fs_1.6.4 matrixStats_1.3.0
[3] spatstat.sparse_3.1-0 sf_1.0-16
[5] httr_1.4.7 RColorBrewer_1.1-3
[7] doParallel_1.0.17 profvis_0.3.8
[9] tools_4.4.1 sctransform_0.4.1
[11] backports_1.5.0 utf8_1.2.4
[13] R6_2.5.1 lazyeval_0.2.2
[15] uwot_0.2.2 urlchecker_1.0.1
[17] withr_3.0.0 sp_2.1-4
[19] GGally_2.2.1 gridExtra_2.3
[21] progressr_0.14.0 quantreg_5.98
[23] cli_3.6.3 textshaping_0.4.0
[25] spatstat.explore_3.2-7 scatterpie_0.2.3
[27] labeling_0.4.3 spatstat.data_3.1-2
[29] proxy_0.4-27 ggridges_0.5.6
[31] pbapply_1.7-2 systemfonts_1.1.0
[33] dbscan_1.2-0 MCMCpack_1.7-0
[35] parallelly_1.37.1 sessioninfo_1.2.2
[37] maps_3.4.2 rstudioapi_0.16.0
[39] generics_0.1.3 gtools_3.9.5
[41] ica_1.0-3 spatstat.random_3.2-3
[43] car_3.1-2 spdep_1.3-5
[45] Matrix_1.7-0 fansi_1.0.6
[47] S4Vectors_0.42.0 abind_1.4-5
[49] lifecycle_1.0.4 carData_3.0-5
[51] SummarizedExperiment_1.34.0 SparseArray_1.4.8
[53] Rtsne_0.17 glmGamPoi_1.16.0
[55] grid_4.4.1 promises_1.3.0
[57] crayon_1.5.3 miniUI_0.1.1.1
[59] lattice_0.22-6 cowplot_1.1.3
[61] pillar_1.9.0 GenomicRanges_1.56.1
[63] boot_1.3-30 corpcor_1.6.10
[65] future.apply_1.11.2 codetools_0.2-20
[67] leiden_0.4.3.1 wk_0.9.1
[69] glue_1.7.0 ggfun_0.1.5
[71] data.table_1.15.4 remotes_2.5.0
[73] vctrs_0.6.5 png_0.1-8
[75] spam_2.10-0 locfdr_1.1-8
[77] RcppML_0.3.7 testthat_3.2.1.1
[79] gtable_0.3.5 cachem_1.1.0
[81] S4Arrays_1.4.1 mime_0.12
[83] coda_0.19-4.1 survival_3.7-0
[85] SingleCellExperiment_1.26.0 iterators_1.0.14
[87] pbmcapply_1.5.1 units_0.8-5
[89] fields_16.2 statmod_1.5.0
[91] ellipsis_0.3.2 fitdistrplus_1.1-11
[93] ROCR_1.0-11 mcmc_0.9-8
[95] nlme_3.1-165 RcppAnnoy_0.0.22
[97] GenomeInfoDb_1.40.1 rprojroot_2.0.4
[99] irlba_2.3.5.1 KernSmooth_2.23-24
[101] colorspace_2.1-0 spData_2.3.1
[103] DBI_1.2.3 UCell_2.8.0
[105] tidyselect_1.2.1 compiler_4.4.1
[107] BiocNeighbors_1.22.0 SparseM_1.84
[109] desc_1.4.3 DelayedArray_0.30.1
[111] plotly_4.10.4 scales_1.3.0
[113] classInt_0.4-10 lmtest_0.9-40
[115] NMF_0.27 stringr_1.5.1
[117] digest_0.6.36 goftest_1.2-3
[119] spatstat.utils_3.0-5 XVector_0.44.0
[121] htmltools_0.5.8.1 pkgconfig_2.0.3
[123] MatrixGenerics_1.16.0 fastmap_1.2.0
[125] rlang_1.1.4 htmlwidgets_1.6.4
[127] UCSC.utils_1.0.0 shiny_1.8.1.1
[129] farver_2.1.2 zoo_1.8-12
[131] jsonlite_1.8.8 BiocParallel_1.38.0
[133] magrittr_2.0.3 GenomeInfoDbData_1.2.12
[135] s2_1.1.6 dotCall64_1.1-1
[137] patchwork_1.2.0 munsell_0.5.1
[139] Rcpp_1.0.12 stringi_1.8.4
[141] brio_1.1.5 zlibbioc_1.50.0
[143] MASS_7.3-61 plyr_1.8.9
[145] pkgbuild_1.4.4 ggstats_0.6.0
[147] parallel_4.4.1 listenv_0.9.1
[149] ggrepel_0.9.5 deldir_2.0-4
[151] splines_4.4.1 tensor_1.5
[153] igraph_2.0.3 spatstat.geom_3.2-9
[155] ggsignif_0.6.4 rngtools_1.5.2
[157] reshape2_1.4.4 stats4_4.4.1
[159] pkgload_1.4.0 foreach_1.5.2
[161] tweenr_2.0.3 httpuv_1.6.15
[163] MatrixModels_0.5-3 RANN_2.6.1
[165] purrr_1.0.2 polyclip_1.10-6
[167] future_1.33.2 scattermore_1.2
[169] gridBase_0.4-7 ggforce_0.4.2
[171] broom_1.0.6 xtable_1.8-4
[173] e1071_1.7-14 ggcorrplot_0.1.4.1
[175] rstatix_0.7.2 later_1.3.2
[177] viridisLite_0.4.2 class_7.3-22
[179] ragg_1.3.2 tibble_3.2.1
[181] registry_0.5-1 memoise_2.0.1
[183] IRanges_2.38.0 cluster_2.1.6
[185] globals_0.16.3 concaveman_1.1.0
Please feel free to contact us at the following email address: li_hua_mei@163.com.


