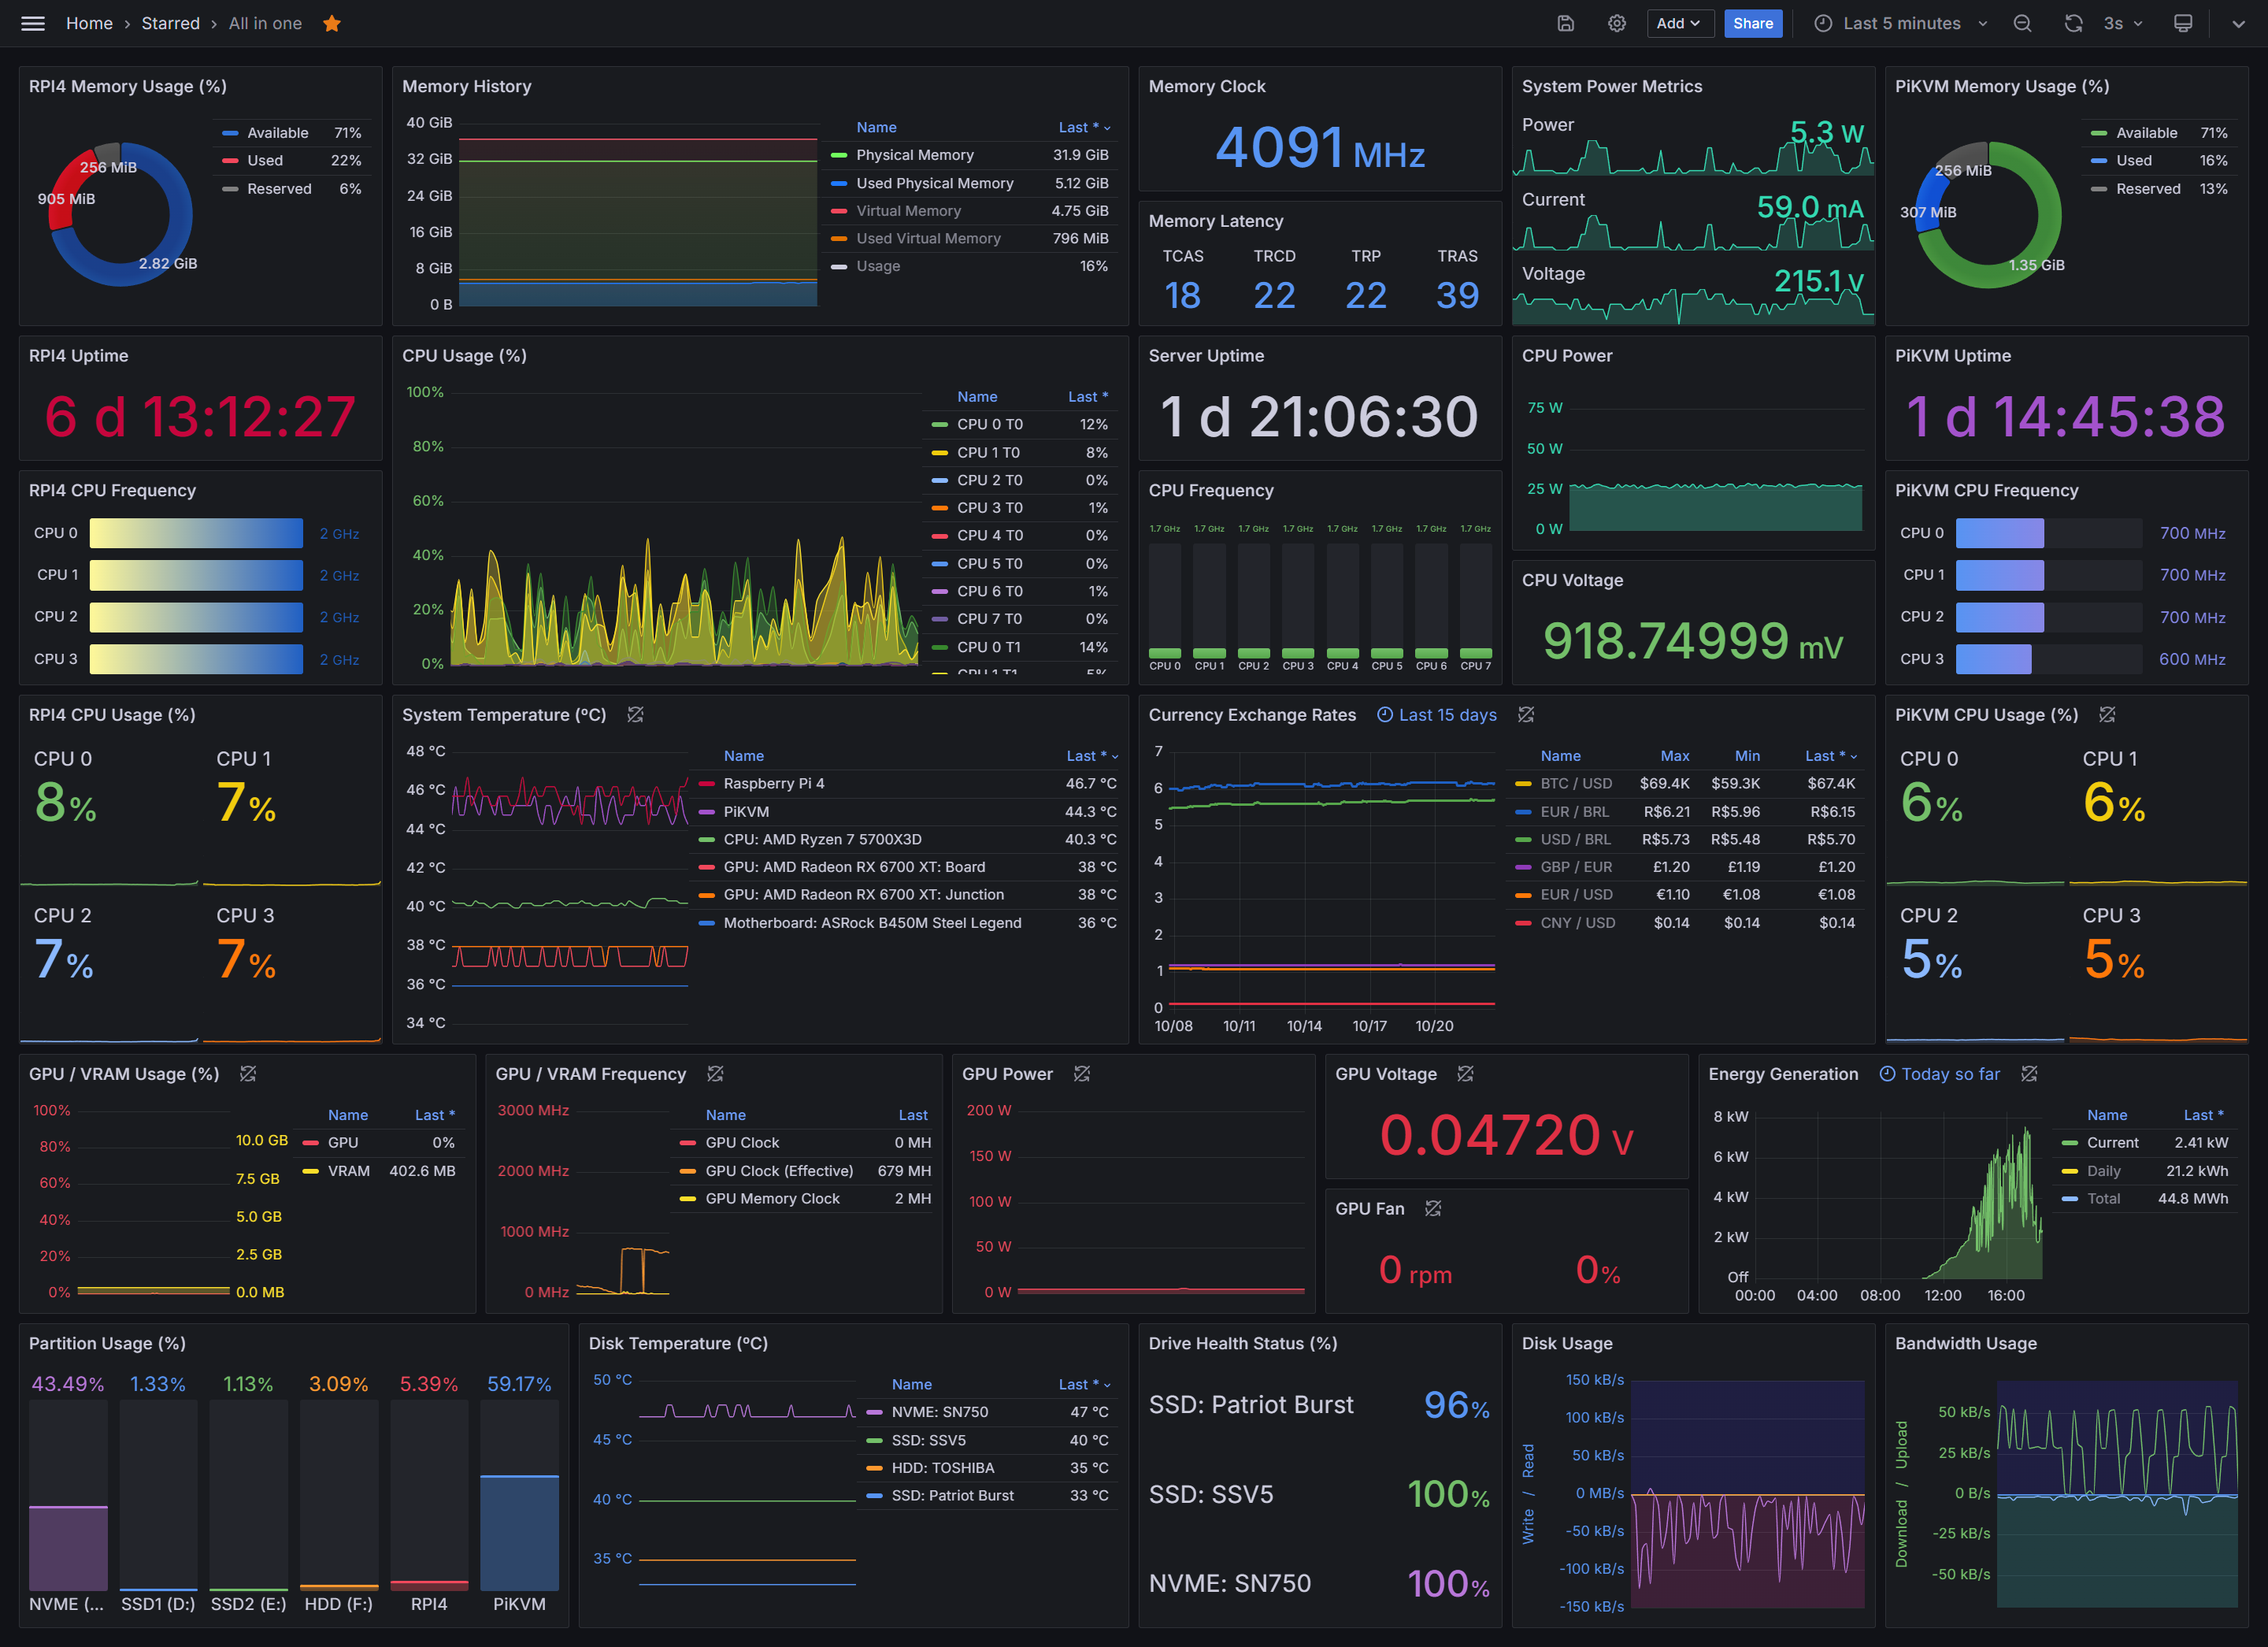
Welcome to Grafana All in One—your all-encompassing monitoring solution designed to integrate various data sources and exporters into a single Grafana dashboard. This project provides a broad view of multiple systems, from Raspberry Pi to solar inverters and smart plugs.
Grafana All in One aggregates metrics from different exporters into a single Grafana dashboard. The solution offers centralized monitoring, allowing you to keep a close watch on devices, track real-time exchange rates, and monitor solar power production efficiently.
-
Node Exporter: Gathers essential hardware and OS metrics, such as CPU, memory, disk, and network usage, from your PiKVM and Raspberry Pi 4 devices. It’s a key component for monitoring system-level performance on Linux-based systems.
-
Windows Exporter: Similar to Node Exporter, but designed for Windows-based systems. It captures system metrics such as CPU usage, memory, disk I/O, and more, helping you monitor the health and performance of your Windows machines.
-
PromDapter: Works in conjunction with HWiNFO to collect detailed hardware metrics from Windows systems. This setup allows you to monitor temperatures, voltages, fan speeds, and other key hardware parameters.
-
Solis Inverter Exporter: Monitors your Solis inverter to collect essential solar power metrics, including current energy generation, daily production, and total output over time.
-
Tuya Smart Plug Exporter: Collects and monitors power consumption, current, and voltage from your Tuya smart plugs, providing detailed insights into the energy usage and electrical characteristics of connected devices.
-
Currency Exporter: A specialized exporter that tracks real-time currency exchange rates. It’s ideal for monitoring financial metrics and keeping tabs on currency fluctuations.
To set up this monitoring solution:
-
Set Up Exporters: Follow the instructions provided in each exporter's repository to set them up on your respective devices. Ensure they are properly configured to expose metrics for Prometheus.
-
Configure Prometheus: Ensure your Prometheus
prometheus.ymlfile includes scrape configs for all the exporters mentioned above. -
Import the Dashboard: Import the Grafana dashboard by following these steps:
- Go to your Grafana instance.
- Navigate to
Dashboards>New>Import. - Enter the dashboard ID
21674and clickLoad. - Assign your data sources to the appropriate panels and save the dashboard.
-
Start Monitoring: Access your Grafana dashboard and start monitoring your systems in real-time.
Check out the Grafana dashboard here: All in one.
This dashboard is designed to provide a comprehensive view of all your systems, seamlessly integrating data from various exporters.
This project is licensed under the Apache License 2.0 - see the LICENSE file for details.
