Dimension Reduction in R
Case-Study Title: Brand Perceptual Map (use PCA for data interpretation)
Data Analysis methodology: CRISP-DM
Dataset: 100 Customers answered 9 questions about 10 brands by likerd spectrum
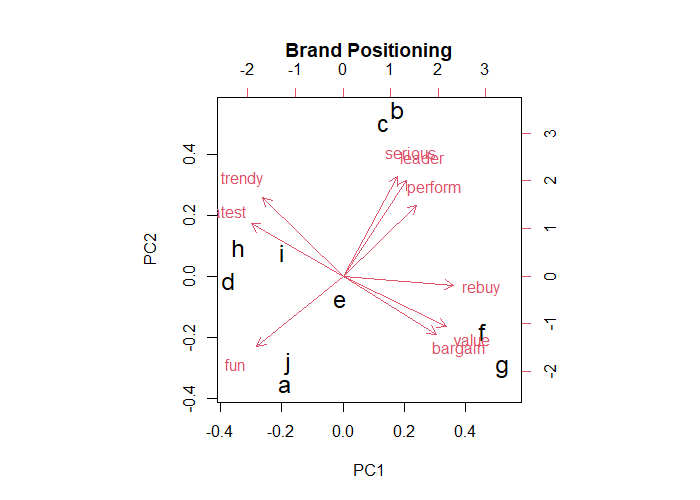
Case Goal: Knowing market atmosphere and Brand Positioning (know situation of 10 different Brands)
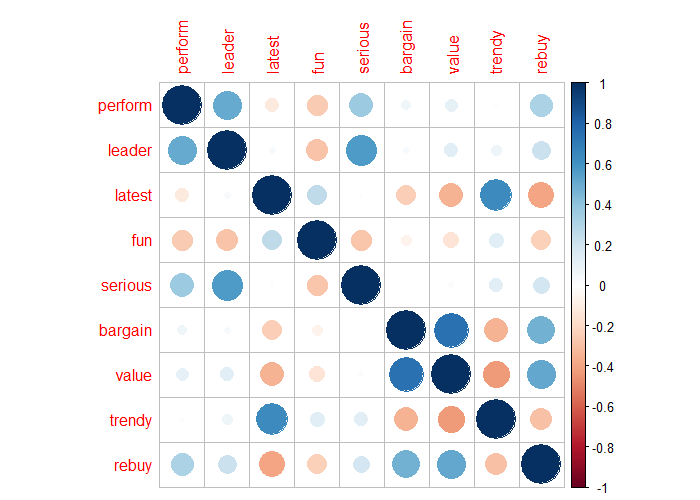
Correlation table between continuous features

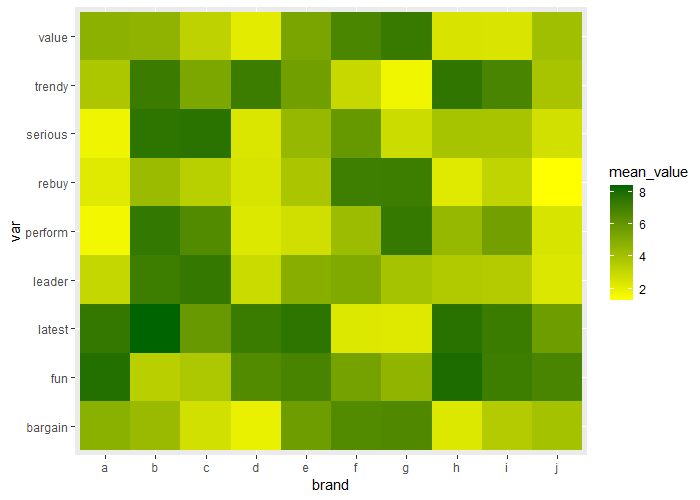
Heat-Map of mean score of every brand in each feature

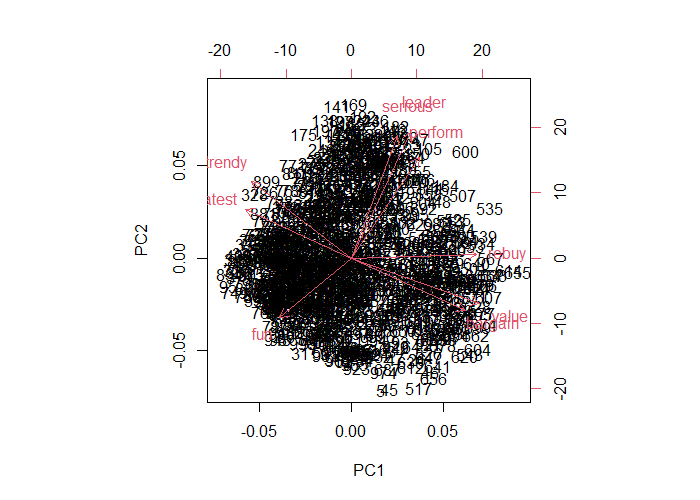
Perceptual Map for all products

Perceptual Map for brands


