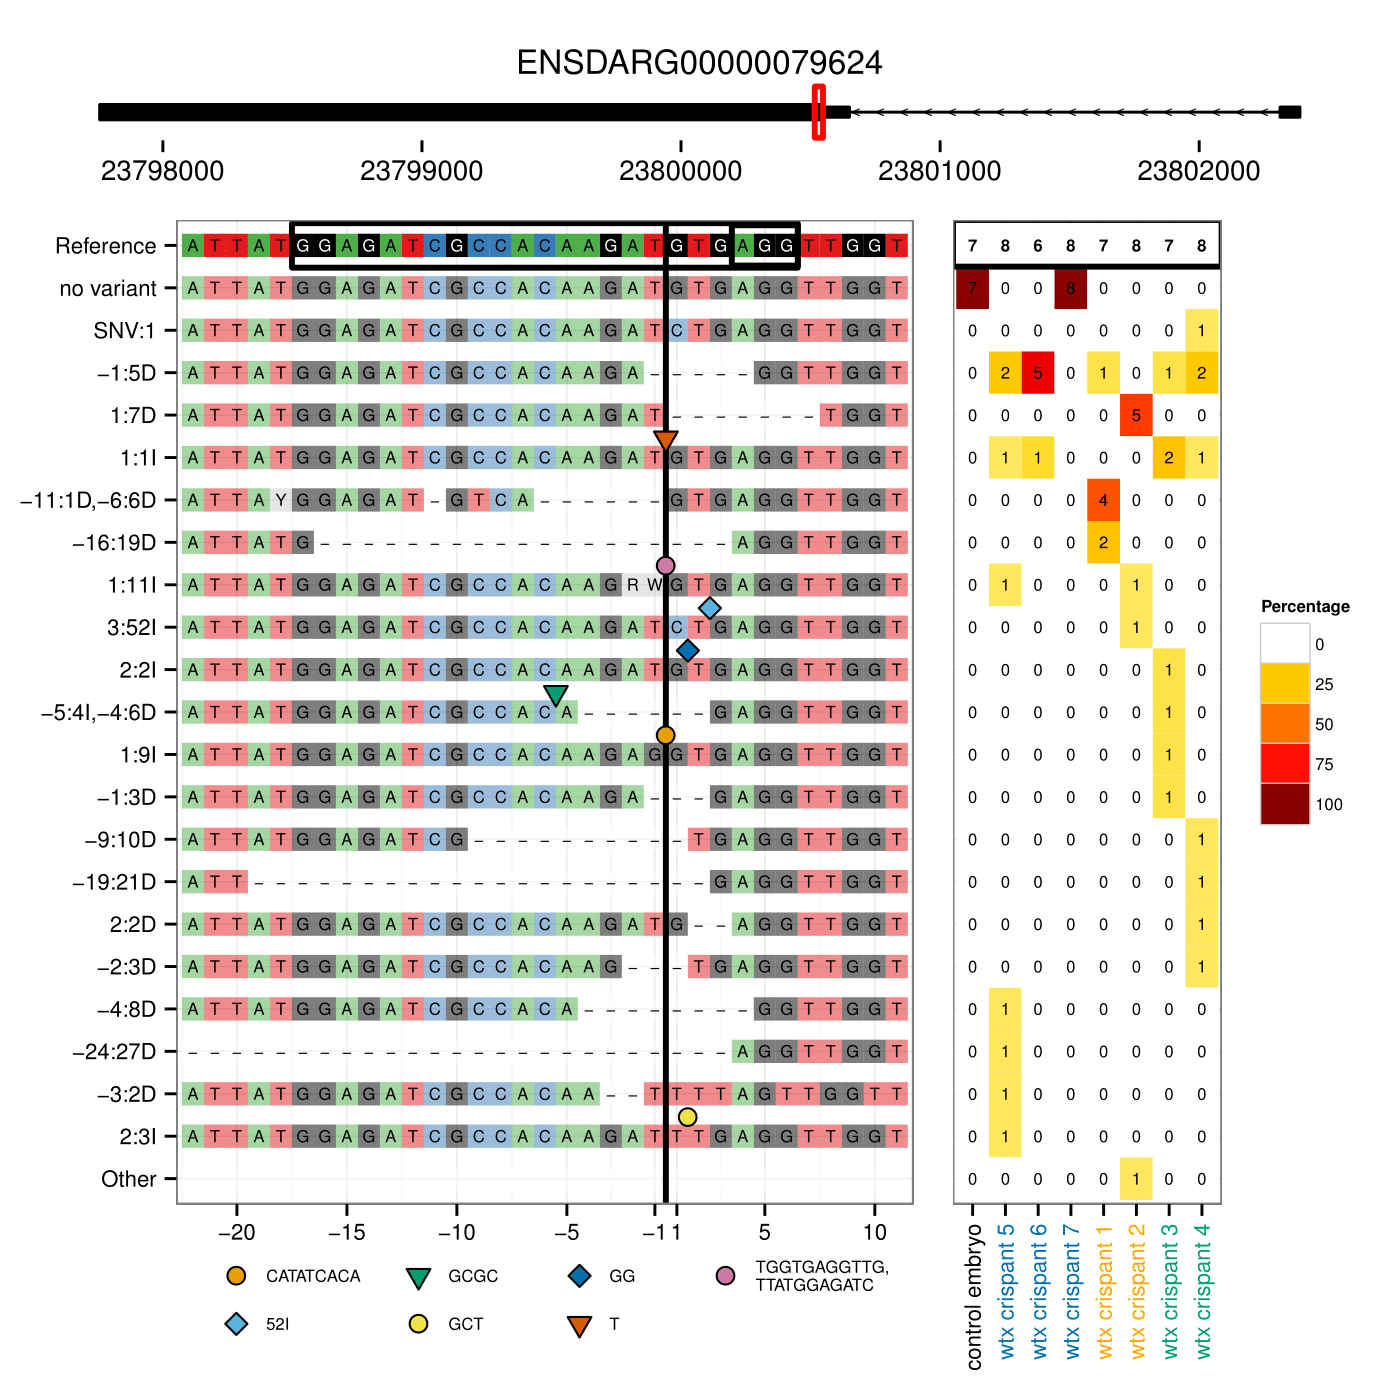
CrispRVariants is an R-based toolkit for counting, localising and plotting targeted insertion and deletion variant combinations, for example, resulting from a CRISPR-Cas9 mutagenesis experiment. Starting from a set of bam files, CrispRVariants narrows the alignments to the target region and renumbers variants with respect to a zero point, typically the Cas9 cut site three bases upstream of the protospacer adjacent motif (PAM). The target region and zero point can be flexibly specified, and the variants may be shown with respect to either DNA strand.
Variants are numbered from their leftmost starting point. For example, a 3bp deletion starting two bases upstream of the cut site is labeled "-2:3D". Single nucleotide variants (SNVs) can optionally be called for sequences that do not contain an insertion or deletion, which can be useful for identifying sequences that differ from the reference sequence.
CrispRVariants can be installed by following the instructions at Bioconductor.
Alternatively, after first installing the devtools package, CrispRVariants can be installed using:
devtools::install_github("markrobinsonuzh/CrispRVariants")Note that this repository contains a developmental version of CrispRVariants and is not compatible with the latest version of Bioconductor devel. This repository will be merged with the Bioconductor repository in future.
The usual starting point is a list of bam filenames ("bams"), the location of the target sequence ("guide") as a GenomicRanges::Granges object, and the reference sequence, as a Biostrings::DNAString ("ref"). You can optionally specify a vector of sample names ("sample_names") corresponding to the bam files, and the target location (target.loc) with respect to the reference. Variant sequences will be renumbered using the target.loc as the zero point. For a 20 nucleotide guide RNA, the target location is base 17, where the double-strand cut occurs.
To count variants within the target region:
crispr.set <- readsToTarget(bams, guide, reference = ref, target.loc = 17,
                            names = sample_names)
Other functions may be used for more complicated experimental designs. For example, if amplicons overlap, CrispRVariants::readsToTargets separates reads by matching the amplicon regions. However, this function can be memory-intensive for large data sets.
A table of the variants can be obtained using:
variantCounts(crispr.set)Mutation efficiency (percentage of reads containing an insertion or deletion) is obtained using:
mutationEfficiency(crispr.set)We recommend looking at the variants prior to calculating efficiency. "plotVariants" produces a summary plot displaying alleles and allele counts along with the location of the guide sequence on overlapping transcripts. The transcripts are identified using a GenomicFeatures Transcript database (TxDb) object.
# where txdb is an object of class TxDb:
plotVariants(crispr.set, txdb = txdb)Each of the above functions can filter the variant alleles in various ways. See the individual help pages for more information.
The user guide is found in the "vignettes" directory
CrispRVariants is available from Bioconductor. Please contact helen (dot) lindsay (at) uzh (dot) ch for more information.
