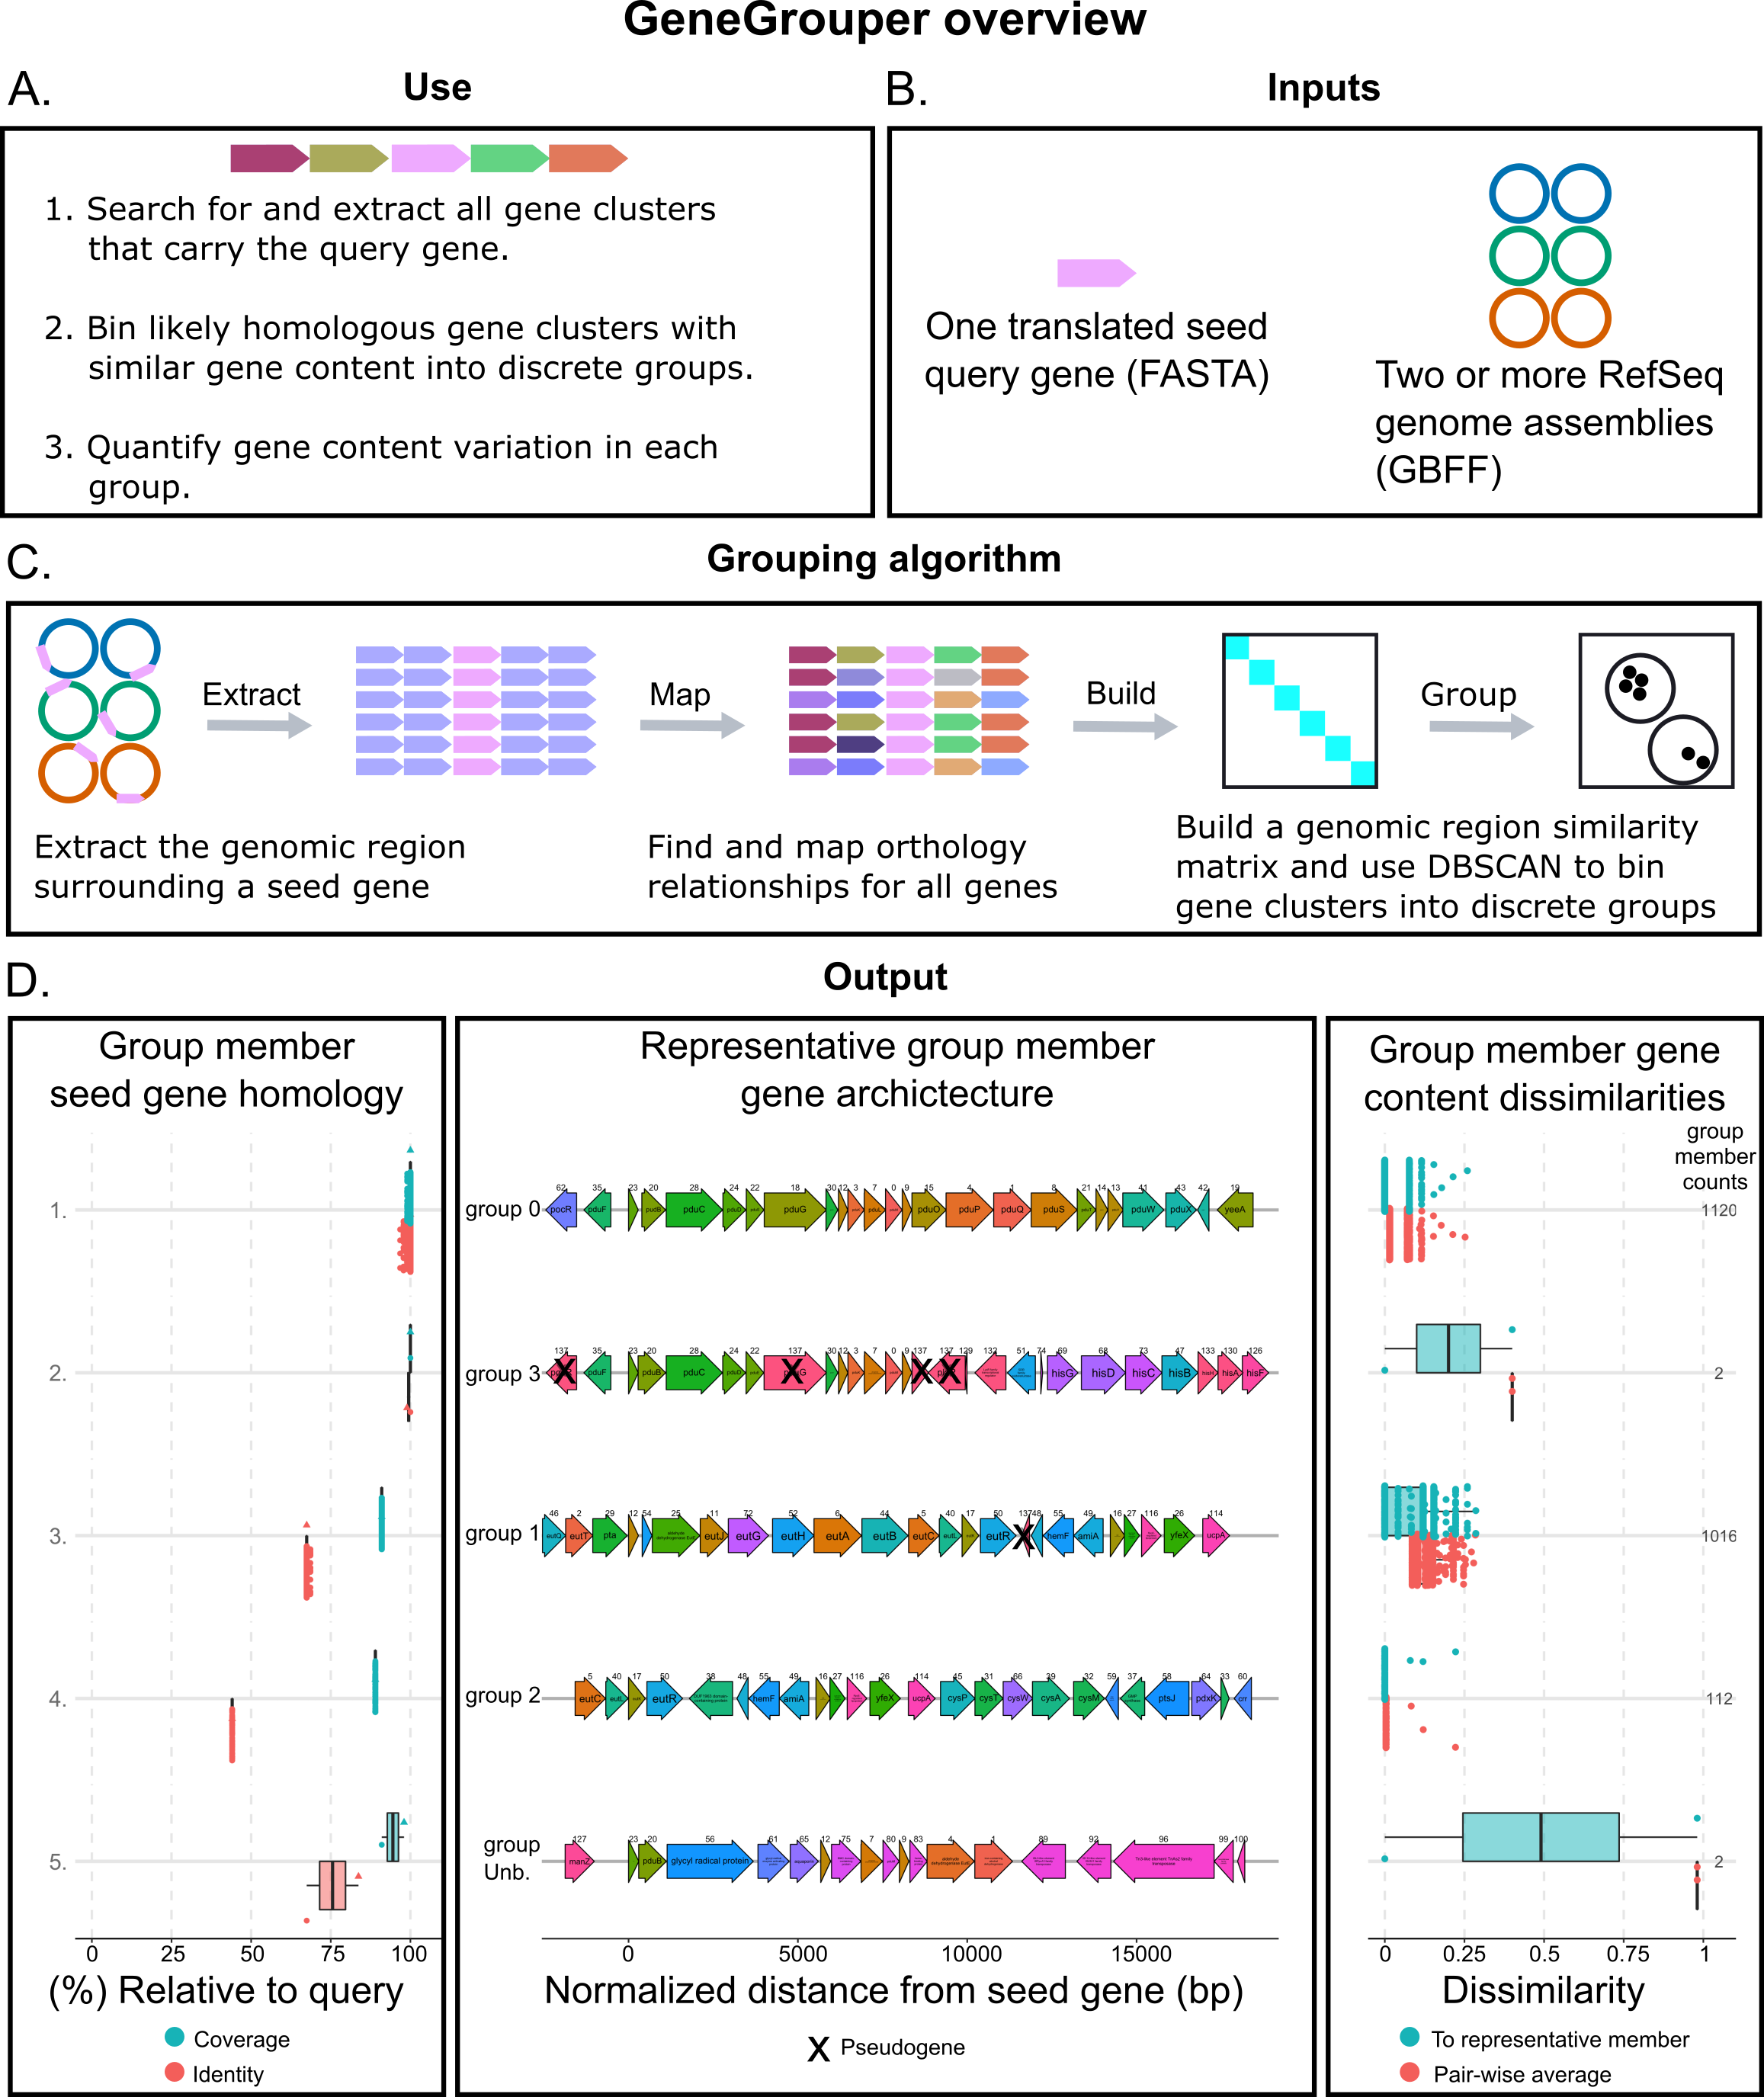
GeneGrouper is a command-line tool that places gene clusters into groups according to how conserved their gene content is. Instead of providing all genes in a gene cluster, you only provide the sequence of one gene and the upstream and downstream coordinates that encompass at least the entire gene cluster. Several visualizations and detailed data tables are provided for further investigation.
GeneGrouper can be installed using pip
pip install GeneGrouper
GeneGrouper has multiple dependences.
Follow the code below to create a self-contained conda environment for GeneGrouper. Recommended
Installing Python and bioinformatic dependencies for grouping
conda create -n GeneGrouper_env python=3.9

source activate GeneGrouper_env #or try: conda activate GeneGrouper_env

conda config --add channels defaults

conda config --add channels bioconda

conda config --add channels conda-forge

pip install biopython scipy scikit-learn pandas matplotlib GeneGrouper

conda install -c bioconda mcl blast mmseqs2 fasttree mafft
Installing R and required packages for visualizations
conda install -c conda-forge r-base=4.1.1 r-svglite r-reshape r-ggplot2 r-cowplot r-dplyr r-gggenes r-ape r-phytools r-BiocManager r-codetools

# enter R environment
R

# install additional packages from CRAN
install.packages('groupdata2',repos='https://cloud.r-project.org/', quiet=TRUE)

# install additional packages from
BiocManager::install("ggtree")

# quit
q(save="no")
For more information, see the installation wiki page
-
A translated gene sequence in fasta format (with file extension .fasta/.txt)
-
A folder containing RefSeq GenBank-format genomes (with the file extension .gbff). See instructions to download many RefSeq genomes at a time.
GeneGrouper -g /path/to/gbff -d /path/to/main_directory \
build_database
Use find_regions to search for regions containing a gene of interest and output to a search-specific directory
GeneGrouper -g /path/to/gbff -d /path/to/main_directory -n gene_search \
find_regions \
-f /path/to/query_gene.fasta
Use visualize --visual_type main to output visualizations of group gene architectures and their distribution within genomes and taxa
GeneGrouper -d /path/to/main_directory -n gene_search \
visualize \
--visual_type main
Use visualize --visual_type group to inspect a GeneGrouper group more closely. Replace <> with a group ID number.
GeneGrouper -d /path/to/main_directory -n gene_search \
visualize \
--visual_type group \
--group_label <>
GeneGrouper -d /path/to/main_directory -n gene_search \
visualize \
--visual_type tree
See tutorial with provided example data
- For each search
find_regionsoutputs:
-
Four tabular files with quantitative and qualitative descriptions of grouping results.
-
One fasta file containing all genes used in the analysis.
- For each search,
visualize --visual_type mainoutputs:
- Three main visualizations provided.
- For each search,
visualize --visual_type group \--group_label <n>outputs:
-
One additional visualization per group, where
--group_label <n>has<n>replaced with the group number. -
Two tabular files containing subgroup information for each
--group_label <n>supplied.
- For each search,
visualize --visual_type treeoutputs:
- One phylogenetic tree of each seed gene in each group.
See complete output file descriptions
Each search and visualization will have the following file structure. Files under visualizations may differ.
├── main_directory
│   ├── search_results
│   │   ├── group_statistics_summmary.csv
│   │   ├── representative_group_member_summary.csv
│   │   ├── group_taxa_summary.csv
│   │   ├── group_regions.csv
│   │   ├── group_region_seqs.faa
│   │   ├── visualizations
│   │   │   ├── group_summary.png
│   │   │   ├── groups_by_taxa.png
│   │   │   ├── taxa_searched.png
│   │   │   ├── inspect_group_-1.png
│   │   │   ├── representative_seed_phylogeny.png
│   │   ├── internal_data
│   │   ├── subgroups
│   │   ├── seed_results.db
usage: GeneGrouper [-h] [-d] [-n] [-g] [-t]
                   {build_database,find_regions,visualize} ...

  -h, --help            show this help message and exit
  -d , --project_directory
                        Main directory to contain the base files used for
                        region searching and clustering. Default=current
                        directory.
  -n , --search_name    Name of the directory to contain search-specific
                        results. Default=region_search
  -g , --genomes_directory
                        Directory containing genbank-file format genomes with
                        the suffix .gbff. Default=./genomes.
  -t , --threads        Number of threads to use. Default=all threads.
    build_database      Convert a set of genomes into a useable format for
                        GeneGrouper
    find_regions        Find regions given a translated gene and a set of
                        genomes
    visualize           Visualize GeneGrouper outputs. Three visualization options are provided.
                        Check the --visual_type help description.
build_database
usage: GeneGrouper build_database [-h]

  -h, --help  show this help message and exit
find_regions
usage: GeneGrouper find_regions [-h] -f  [-us] [-ds] [-i] [-c] [-hk] [--min_group_size] [-re] [--force]

  -h, --help            show this help message and exit
  -f , --query_file     Provide the absolute path to a fasta file containing a translated gene sequence.
  -us , --upstream_search
                        Upstream search length in basepairs. Default=10000
  -ds , --downstream_search
                        Downstream search length in basepairs. Default=10000
  -i , --seed_identity
                        Identity cutoff for initial blast search. Default=60
  -c , --seed_coverage
                        Coverage cutoff for initial blast search. Default=90
  -hk , --seed_hits_kept
                        Number of blast hits to keep. Default=None
  --min_group_size
                        The minimum number of gene regions to constitute a group. Default=ln(jaccard distance length)
  -re , --recluster_iterations
                        Number of region re-clustering attempts after the initial clustering. Default=0
  --force               Flag to overwrite search name directory.
visualize
usage: GeneGrouper visualize [-h] [--visual_type] [--group_label]

  --visual_type      Choices: [main, group, tree]. Use main for main visualizations. Use group to
                     inspect specific group. Use tree for a phylogenetic tree of representative
                     seed sequencess. Default=main
  --group_label      The integer identifier of the group you wish to inspect. Default=-1
  --image_format     Choices: [png, svg]. Output image format. Use svg if you want to edit the
                     images. Default=png.
  --tip_label_type   Choices: [full, group]. Use full to include the sequence ID followed by group
                     ID. Use group to only have the group ID. Default=full
  --tip_label_size   Specify the tip label size in the output image. Default=2
Alexander G McFarland, Nolan W Kennedy, Carolyn E Mills, Danielle Tullman-Ercek, Curtis Huttenhower, Erica M Hartmann, Density-based binning of gene clusters to infer function or evolutionary history using GeneGrouper, Bioinformatics, 2021;, btab752, https://doi.org/10.1093/bioinformatics/btab752
Please message me at alexandermcfarland2022@u.northwestern.edu if you have any questions or comments!
Follow me on twitter @alexmcfarland_!
