The universal hierarchical data viewer
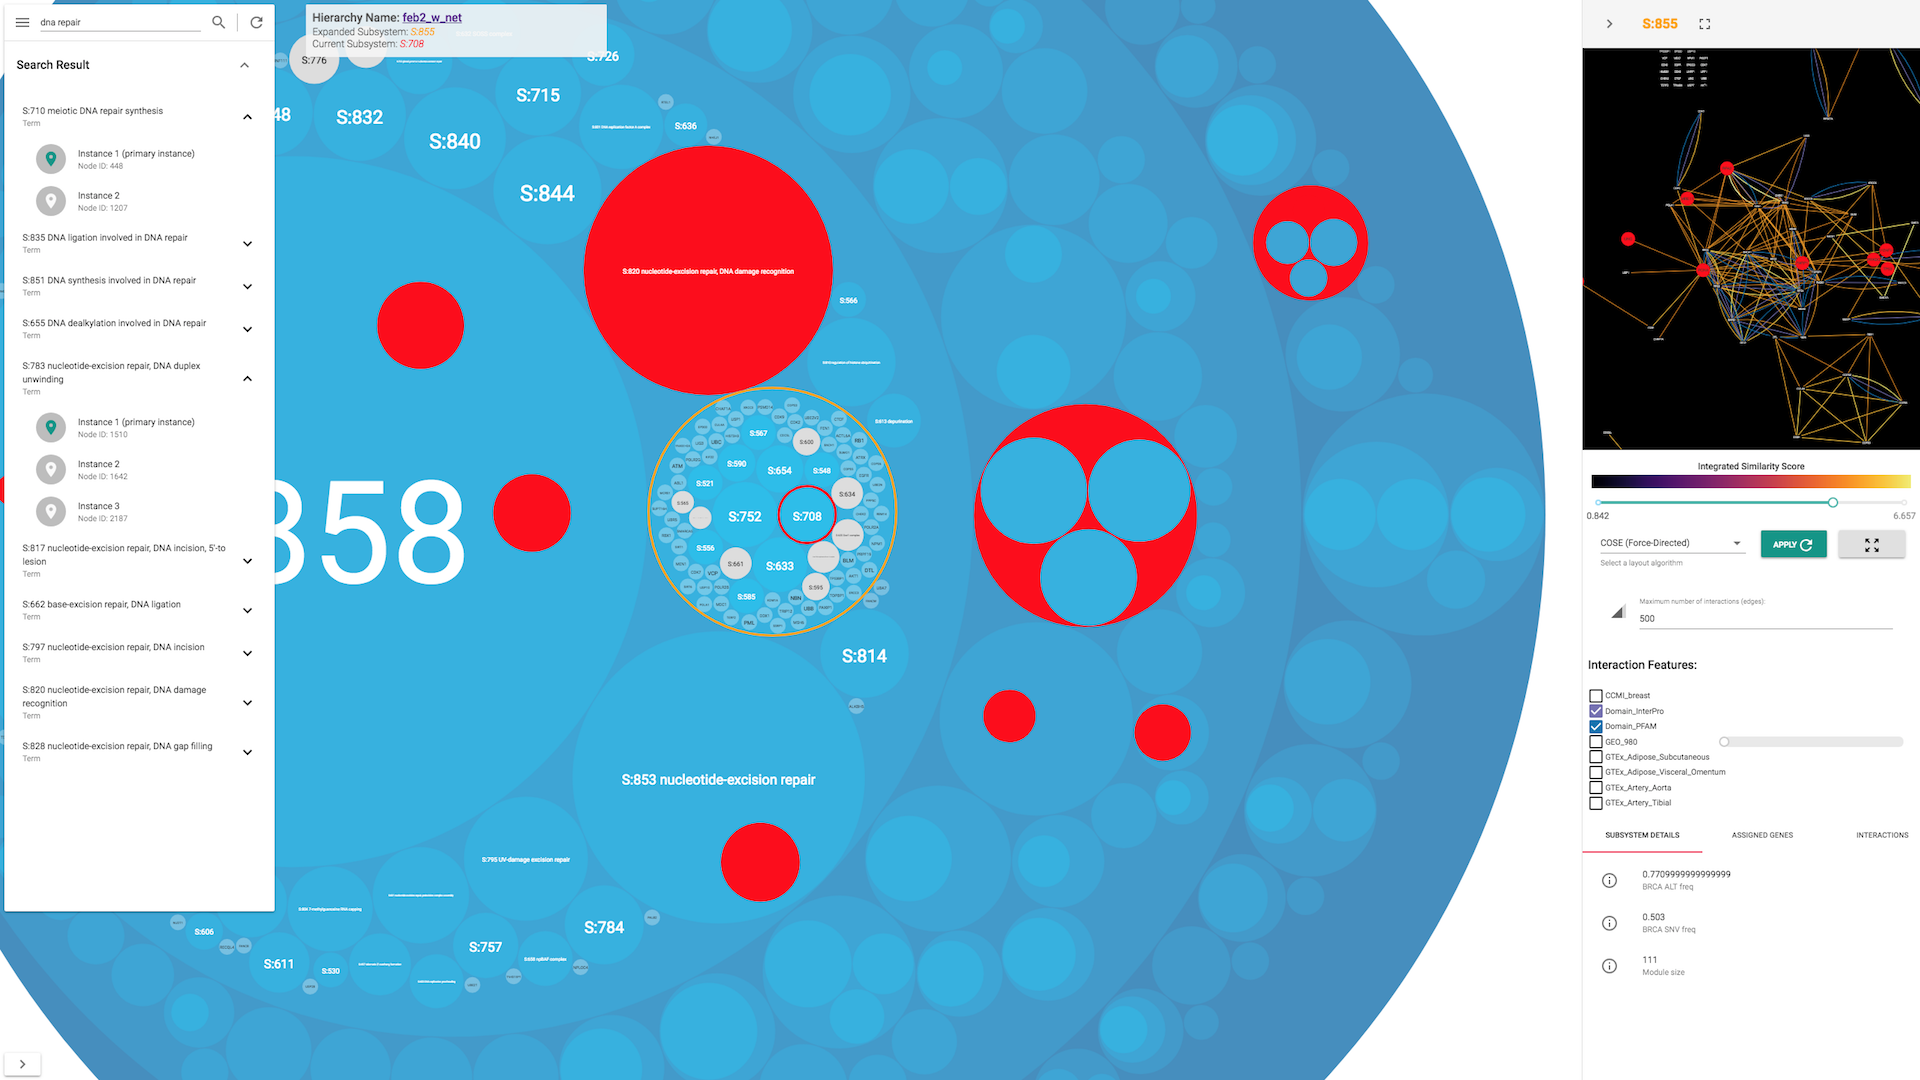
 (fig1: Circle packing view for a hierarchy generated by DDOT)
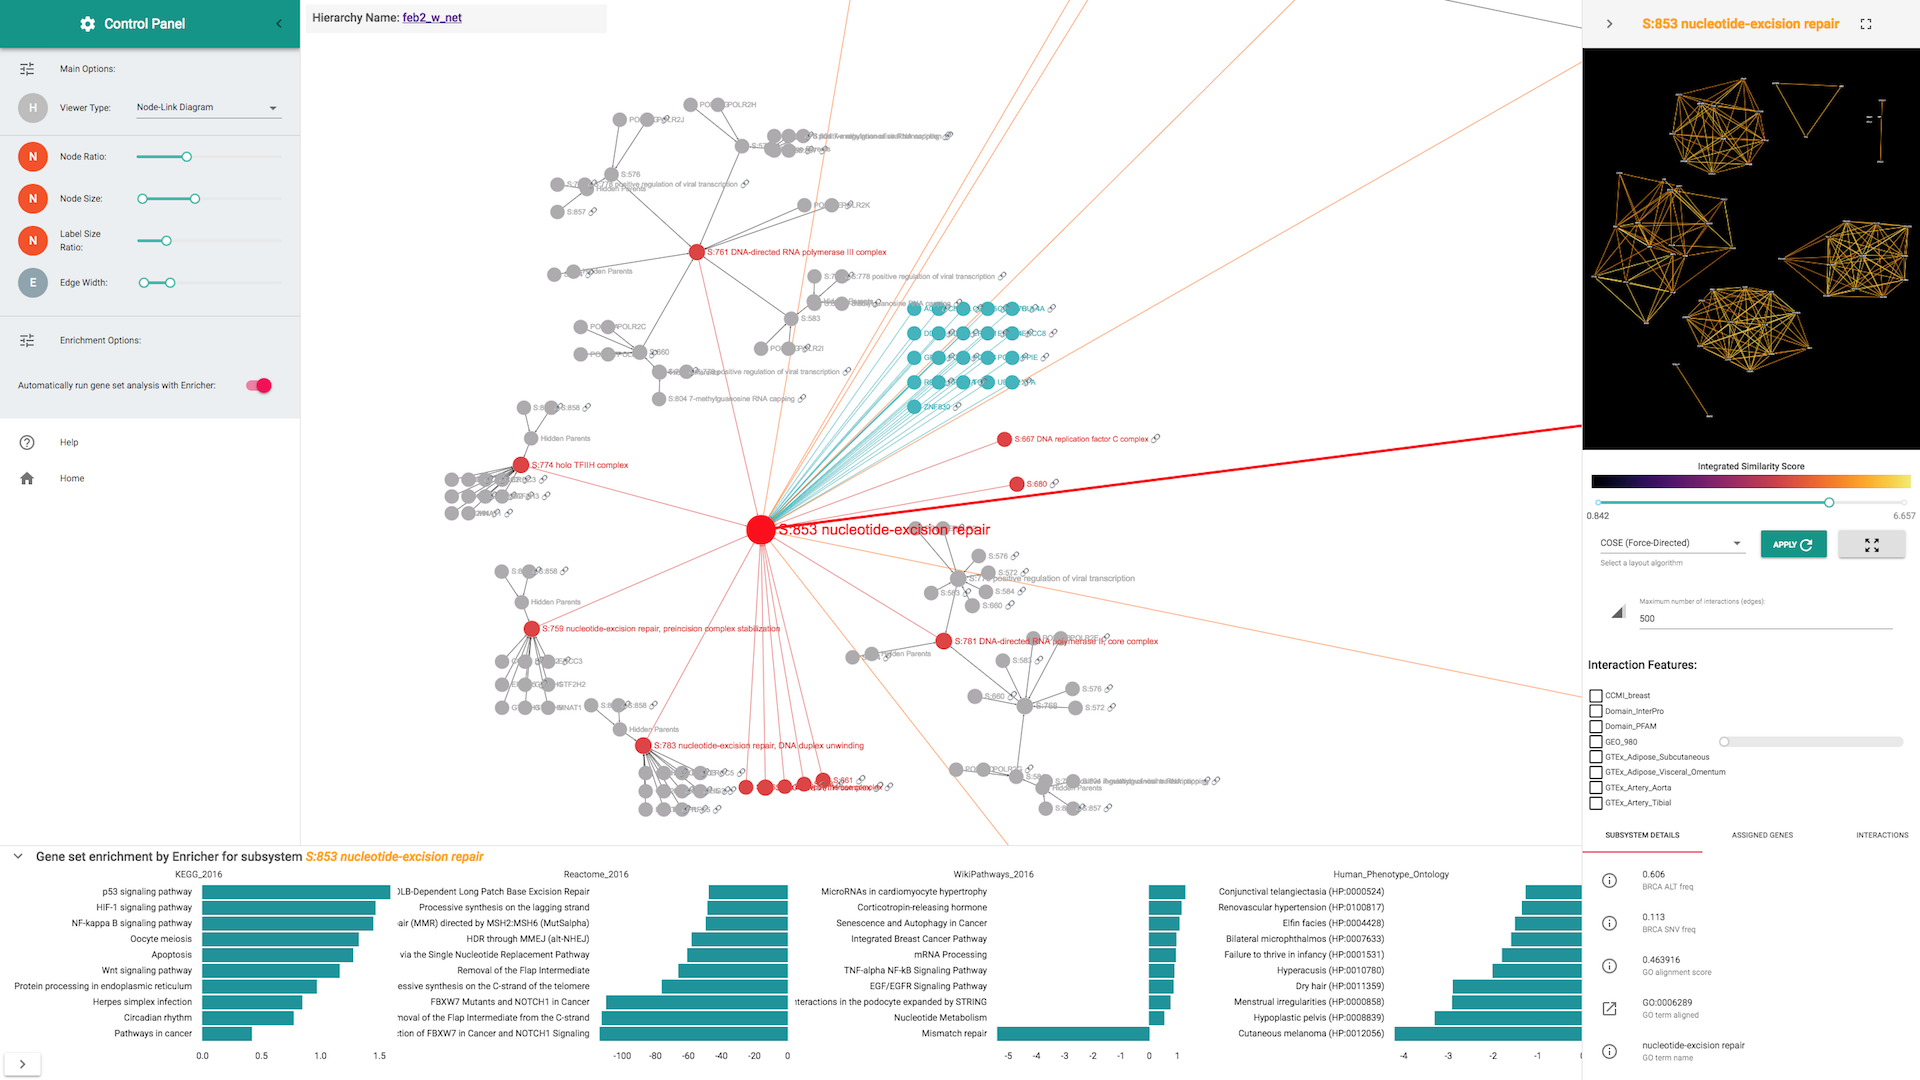
 (fig2: Samge data visualized in node-link diagram mode)
- 6/11/2018 - v1 in beta
- 9/20/2017 - Updated for new version
HiView is a React-based web application for visualizing hierarchical data generated by the DDOT pipeline.
Reference implementation is available here:
To try this viewer, click the EXAMPLES button to select a pre-computed hierarchy and press START. Double-click the subsystems to expand internal substructures.
(TBD)
- Checkout this repository
- Clone CyViewer module
- yarn install
- yarn link
- In the frontend directory, run
yarn link cy-viewer yarn start
(TBD)
- UX Design
- Architecture Design
- Support for small to medium size data
- Public data only
- Automatic enrichment analysis
- Large data support
- e.g., human dataset
- Private data support (for NDEx)
(TBD)
© 2017 - 2018 UC, San Diego Trey Ideker Lab
Application is designed and implemented by Keiichiro Ono (kono ucsd edu). Data-Driven