This pipeline is designed for image patch and whole slide level nuclei detection, segmentation and TME feature extraction. The pipeline uses HD-Yolo algorithm by default for real-time nuclei segmentation cross the whole slide and utilize the results for TME feature analysis. There are four components in this repo.
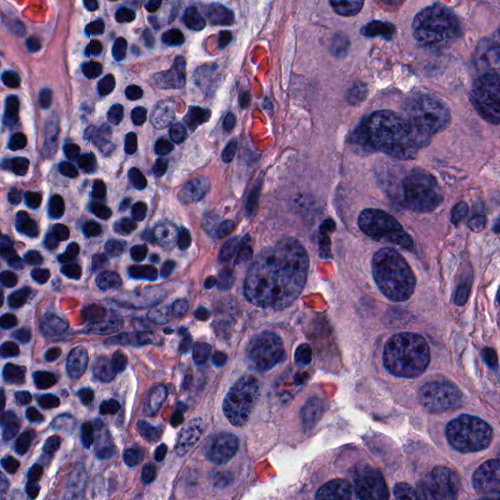
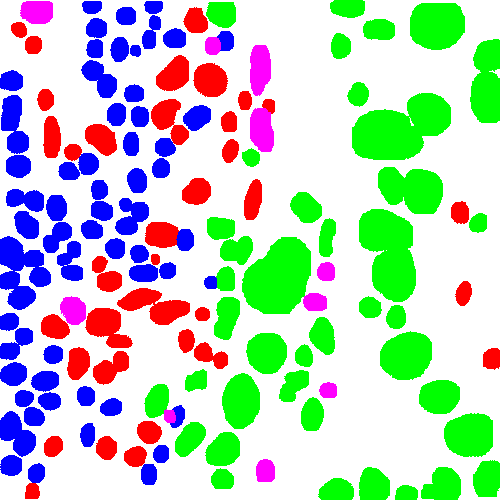
The first component (run_patch_inference.py) runs a pretrained object detection/segmentation model on image patchs and outputs nuclei locations, types and masks. This process can be done in realtime and is integrated into our realtime deepzom server.
| Sample input patch | Nuclei segmentation |
|---|---|
 |
 |
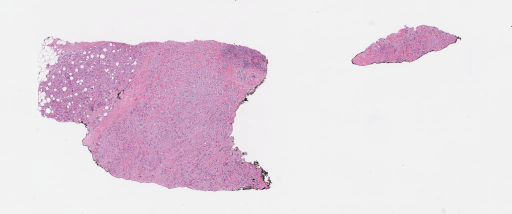
The second component (run_wsi_inference.py) applies a pretrained object detection/segmentation model on whole slide images and outputs nuclei locations, types and masks. Results can be viewed through deepzoom server.
| Sample input slide | Nuclei segmentation |
|---|---|
 |
 |
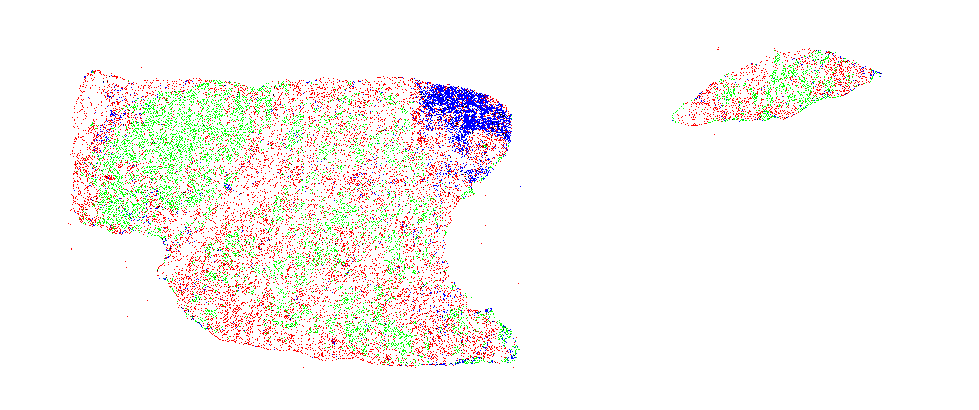
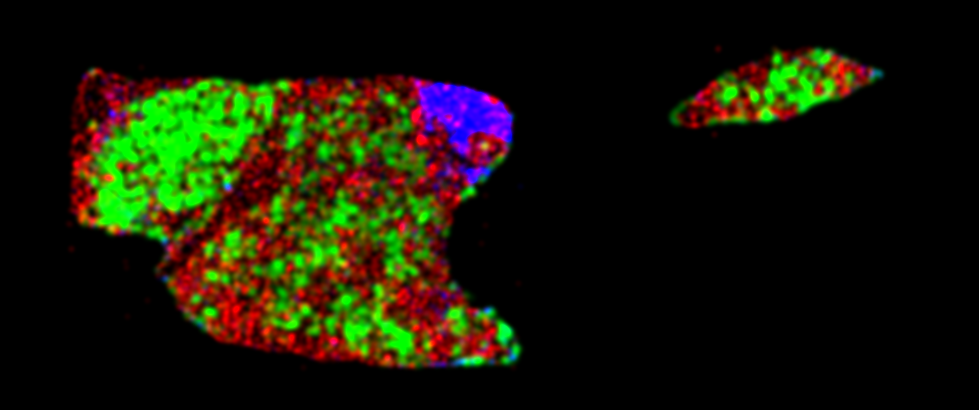
The third component (summarize_tme_features.py) extract nuclei morphological features and further utilizes density-based feature extraction module to summarize slide level and ROI level TME features. All nuclei detected above will be allocated into a 2d point cloud and further smoothed into a density maps that reflect nuclei distribution. Then multiple Delaunay graph based and density based TME features will be calculated.
| Nuclei scatter plot | Nuclei density plot |
|---|---|
 |
 |
The last component (app.py) provides a web interface to view slides and run HD-Yolo. The application will automatically start through docker.
Dependencies can be installed through conda or docker. A Nvidia GPU device is recommended to run the WSI analysis (run_wsi_inference.py) on large dataset. For devices with AMD and M1/M2 GPU, please follow PyTorch Installation to install the correct components. The required GPU memory depends on the model size and batch size. By default, the HD-Yolo model takes 16GB memory for optimized performance.
Step 1. Install Anaconda/Miniconda from (https://www.anaconda.com)
Step 2. clone the repo and install the environment:
git clone https://github.com/impromptuRong/hd_wsi.git
cd hd_wsi
conda env create -n hd_env --file environment.yaml
conda activate hd_env
Step 3. Download pretrained models. We provide 2 pretrained HD-Yolo models for lung cancer and breast cancer. Download the pretrained models from the list below and make sure the paths to these models are consistent with the MODEL_PATHS parameters in the configs.py.
When using customized model, be sure the torchscript model will output the results in the format (losses: Optional, outputs: Dict[str, torch.Tensor]) with required keys: 'boxes', 'labels', 'scores', and optional keys 'masks', 'keypoints', etc in outputs. (See torchvision MaskRCNN format for details).
Step 1. Install Docker
Step 2. Download the docker image
docker pull imprompturong/hd_wsi:latest
docker tag imprompturong/hd_wsi:latest hd_wsi:latest
Or build docker image from scratch
docker build -t hd_wsi:latest .
Step 3. Start the docker web interface
docker run -p 5000:5000 -v `readlink -f /path/to/slides_folder`:/usr/src/hd_wsi/slides_folder hd_wsi:latest
Or use the command line interface (increase shared memory size either with --ipc=host or --shm-size, use --gpus all to enable multiple gpu cards if needed.)
docker run --ipc=host -dit -v /path/to/slides_folder:/usr/src/hd_wsi/slides_folder --name hd_wsi hd_wsi:latest
docker exec -it hd_wsi /bin/bash
conda activate hd_env
The script run_patch_inference.py analyzes a single image patch or a folder of image patches with given model and outputs nuclei detection and segmentation results. Image patches are analyzed one-by-one without parallel, so image patches with different sizes are allowed. By default, model uses breast cancer HD-Yolo model to segment the following nuclei: tumor, stromal, immune, blood, macrophage, necrosis and others. mpp need to be specified with option --mpp. The script will automatically align image patch scale to default scale (mpp=0.25, 40x) during inference and convert result to the original input size. Run python run_patch_inference.py -h for all options.
Example 1. Produce the result of a 40x lung cancer image patch displayed in the introduction:
python run_patch_inference.py --data_path assets/9388_1_1.png --output_dir ./ --device cpu
Example 2. Run lots of 20x patches with mpp=0.5 on GPU
python run_patch_inference.py --data_path /path/to/patch_folder --output_dir /path/to/output_patches --mpp 0.5
The script run_wsi_inference.py accepts a single slide or a folder of slides as inputs and outputs nuclei detection and segmentation results from given model. By default, model uses breast cancer HD-Yolo model to detect the following nuclei: tumor, stromal, immune, blood, macrophage, necrosis and others. Slides with different magnification and mpp will be aligned to mpp=0.25 (40x) during inference but convert back to the original mpp and scale in results. Run python run_wsi_inference.py -h for all options.
Example 1. Quick start with pretrained breast cancer model on the sample BRCA slide with default options:
python -u run_wsi_inference.py --data_path sample.svs --output_dir test_wsi
Example 2. Run whole slide inference with lung cancer model under limited computational resources:
python -u run_wsi_inference.py --data_path sample.svs --model lung --output_dir test_results --save_img --batch_size 4 --num_workers 8 --max_memory 1000
Example 3. Detect only box on cpu with the default lung cancer model and export result to csv
python -u run_wsi_inference.py --data_path sample.svs --model_path lung --output_dir test_wsi_box_only --device cpu --box_only --save_csv
Example 4. Run a customized model on a folder of slides with annotations. Export results to image, and save mask and text information into csv file.
python -u run_wsi_inference.py \
--data_path /path/to/folder \
--meta_info text_color_info.yaml \
--model_path /path/to/model/ \
--output_dir /path/to/output_wsi \
--batch_size 4 --roi tissue
--save_img --save_csv \
--export_mask --export_text
The script summarize_tme_features.py takes the outputs from a) to extract a variety of nuclei and TME features. Currently, the following nuclei features and TME features are calculated:
Nuclei morphological features
- i.radius: average radius for nuclei type_i base on bounding bx size.
- i.total: total amount of nuclei type_i detected in results file.
- i.box_area.*: statistics of bounding box area of type_i.
- i.area.*: statistics of mask area of type_i.
- i.convex_area.*: statistics of mask convex_area of type_i.
- i.eccentricity.*: statistics of mask eccentricity of type_i.
- i.extent.*: statistics of mask extent of type_i.
- i.filled_area.*: statistics of mask filled_area of type_i.
- i.major_axis_length.*: statistics of mask major_axis_length of type_i.
- i.minor_axis_length.*: statistics of mask minor_axis_length of type_i.
- i.orientation.*: statistics of mask orientation of type_i.
- i.perimeter.*: statistics of mask perimeter of type_i.
- i.solidity.*: statistics of mask solidity of type_i.
- i.pa_ratio.*: statistics of mask pa_ratio (perimeter ** 2 / filled_area) of type_i.
Delaunay graph based features
- i_j.edges.mean: average nuclei distance of type_i <-> type_j interactions.
- i_j.edges.std: nuclei distances std of type_i <-> type_j interactions.
- i_j.edges.count: total No. of type_i <-> type_j interactions in all patches.
- i_j.edges.marginal.prob: i_j.edges.count/sum(x_y.edges.count), percentage of type_i <-> type_j interaction.
- i_j.edges.conditional.prob: i_j.edges.count/sum(x_j.edges.count), edge probability condition to type_j interaction.
- i_j.edges.dice: dice coefficient of i_x.edges and y_j.edges, overlap over union of type_i interaction and type_j interaction.
Density based features
- roi_area: overall tumor/tissue region.
- i_j.dot: dot product between type_i and type_j.
- i.norm: norm2(type_i), type_i density.
- i_j.proj: i_j.dot / j.norm, influence of type_i on type_j.
- i_j.proj.prob: use sigmoid activation to normalize i_j.proj into 0~1.
- i_j.cos: i_j.dot/i.norm/j.norm, similarity of type_i and type_j.
By default, Delaunay graph based features are summarized from a maximum of 10 random selected patches (2048*2048) in tumor region. Density based features are calculated with kernel smoothed density map that is 1/32 of the original image scale. Parameters can be changed based on needs, run python summarize_tme_features.py -h for detailed information about all options.
Example 1. Analyze results from sample.svs and save plots with default settings.
python -u summarize_tme_features.py --model_res_path test_wsi --output_dir ./test_features --n_classes 3 --save_images
Example 2. Customize Delaunay graph based and density based features: randomly select 100 512x512 patches with more than 10 tumor and calculate density under 1/16
python -u summarize_tme_features.py \
--model_res_path /path/to/output_wsi \
--output_dir /path/to/output_tme \
--n_patches 100 --patch_size 512 \
--score_thresh 10 --scale_factor 16 \
--save_images \
A web application is provided to visualize slides and do real time segmentation. The web interface is for demostration purpose only. It's not ready for real product. Example 1: start the server by default:
ln -s /path/to/slides slides_folder
python app.py
Example 2: run the server on a different address and port under debug mode:
ln -s /path/to/slides slides_folder
uvicorn app:app --host 127.0.0.1 --port 5005 --workers 32 --log-level debug --reload
Example 3: start through docker
docker run -p 5000:5000 -v `readlink -f /path/to/slides_folder`:/usr/src/hd_wsi/slides_folder hd_wsi:latest
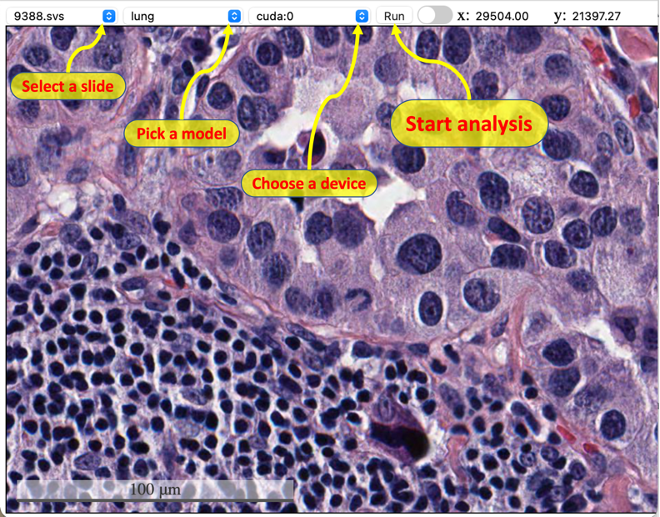
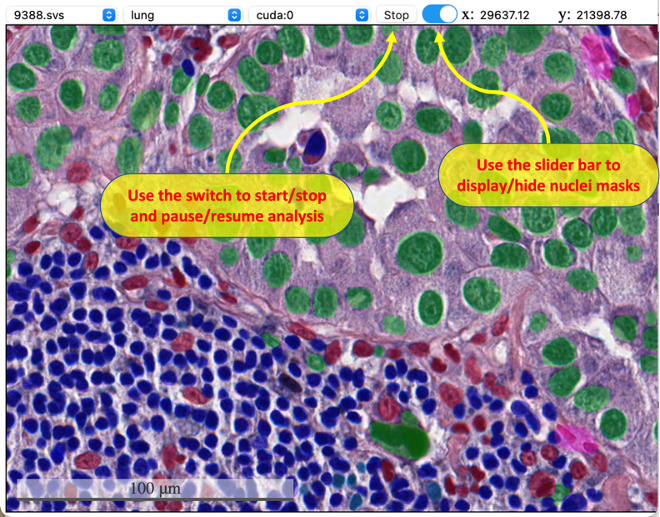
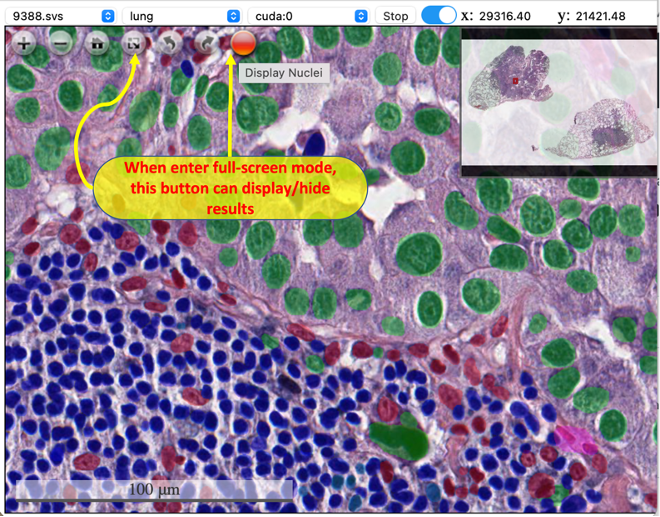
The user interface is simple: i). Select a slide, model, and device from the dropdown list; ii). Click the button "Run" to start auto nuclei segmentation; iii). Trigger the slide bar between On/Off to display/hide the results. When entering full screen mode, user can't stop/start the analysis (the top menu will dispear), but can still use the button inside viewer to control whether to display the result. If there are tiles with no results in your current view, use the togger button or slide bar to refresh the cached tiles.
| Start analysis | Display masks | Full Screen |
|---|---|---|
 |
 |
 |
slide_id_pred.pt: The torch file stores the outputs and inference time.slide_id_pred.png: The image file displays the segmentation/detection results.slide_id_pred.csv: The csv file containsboxes,scores,labelsandmasksinfo if--box_onlyis not triggered.
slide_id.pt: The compressed object contains slide information, nuclei locations, scores and types, as well as inference time.slide_id.masks.pt: If model outputs masks and--box_onlyis not enabled, all nuclei masks shrinked into 28x28 pixel are stored in this file.slide_id.tiff: If--save_imgis enabled, script will plot a large pyramid tiff image with the same size as input slide (nuclei color are provided through--meta_infowith default transparency = 0.3). This file can be viewed through openslide and other tiff viewers. Don't enable this option for large image as it will take extremely long time to plot and save.slide_id.csv: If--save_csvis enabled, script will exportboxes,scores,labelsinto this csv file. If--export_textis enabled, script will replace numeric labels with text labels defined in--meta_info. If--export_maskis enabled, an extra column contains masks in polygon format will be added to the csv file. Note that TME feature extraction pipeline takesslide_id.ptas input, the csv file is not necessary for downstream analysis. Export csv with text and masks will cost extra time and take more space.
slide_id/feature_summary.csv: The csv file of slide_id x tme_features. Currently the following TME features are calculated.slide_id/feature_summary.pkl: The pickle file contains all the raw features without normalization/standardization (count, norm, dotproduct, etc.). This is useful when merging multiple slides under same patient.slide_id.slide_img.png: If--save_imagesis enabled, script will generate this thumbnail image.slide_id.scatter_img.png: If--save_imagesis enabled, script will generate a scatter plot for detection result.slide_id.density_img.png: If--save_imagesis enabled, script will export density plot for core nuclei type (by default, green: tumor, red: stromal, blue: immune).slide_id.roi_mask.png: If--save_imagesis enabled, script will export the roi region for feature extraction. (default is tumor region)
A Deep Learning Approach for Histology-Based Nuclei Segmentation and Tumor Microenvironment Characterization
@article{rong2023deep,
  title={A Deep Learning Approach for Histology-Based Nucleus Segmentation and Tumor Microenvironment Characterization},
  author={Rong, Ruichen and Sheng, Hudanyun and Jin, Kevin W and Wu, Fangjiang and Luo, Danni and Wen, Zhuoyu and Tang, Chen and Yang, Donghan M and Jia, Liwei and Amgad, Mohamed and others},
  journal={Modern Pathology},
  pages={100196},
  year={2023},
  publisher={Elsevier}
}
If you have any questions or suggestions, please contact the following:
Developer: Ruichen Rong (ruichen.rong@utsouthwestern.edu)
Maintainer: Hudanyun Sheng (hudanyun.sheng@utsouthwestern.edu)
Corresponding: Shidan Wang (shidan.wang@utsouthwestern.edu)
Corresponding: Xiaowei Zhan (xiaowei.zhan@utsouthwestern.edu)
Corresponding: Guanghua Xiao (guanghua.xiao@utsouthwestern.edu)
