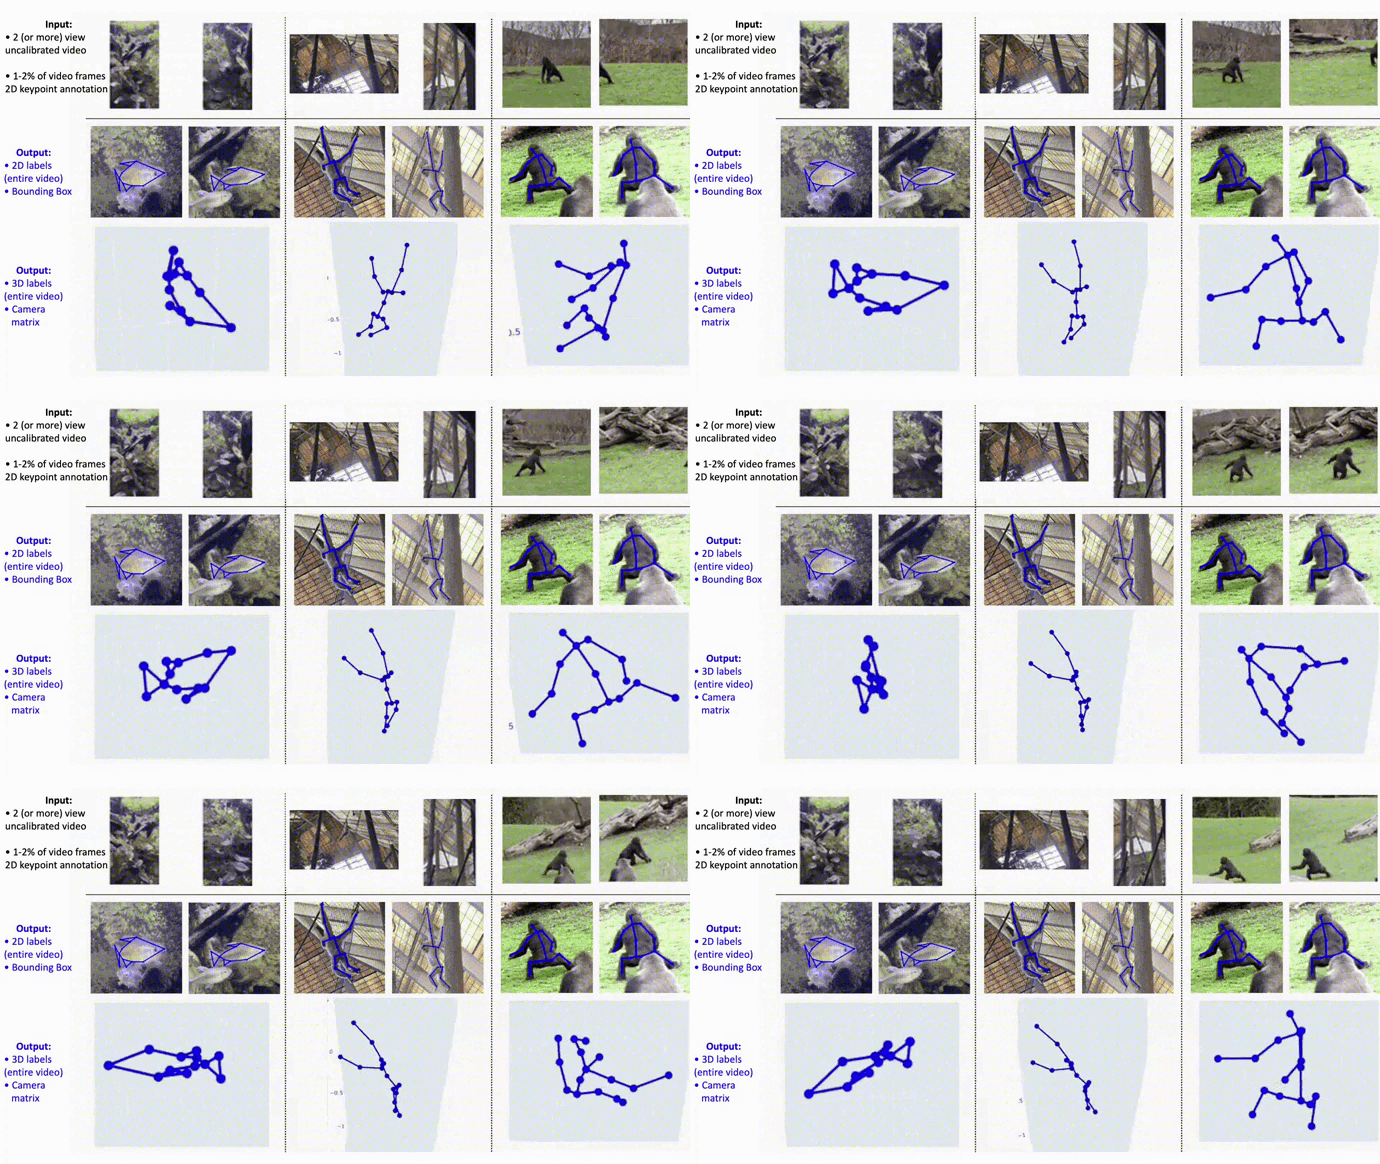
Multiview Bootstrapping in the Wild (MBW) provides a powerful way of generating labeled data in the wild at scale. Thereby, it democratizes the domain of data collection to a plethora of machine learning-driven computer vision applications via its novel self-supervision technique.
- Tested in
Pytorch 1.11, withCUDA 11.3
- Create a conda environment and activate it.
conda env create -f environment_<cpu/gpu>.yml (change the flag within <> based on the available system) conda activate mbw pip install opencv-python - Please do a clean install of the submodule
robust_loss_pytorch:cd modules/helpers/robust_loss_pytorch pip install git+https://github.com/jonbarron/robust_loss_pytorch - Please do a clean install of the submodule
torch_batch_svd: (if using GPU)cd modules/helpers/torch-batch-svd export CUDA_HOME=/your/cuda/home/directory/ python setup.py install
-
Fetch the pre-trained flow and detector models from Zenodo using:
zenodo_get 10.5281/zenodo.7054596 unzip models.zip rm -rf models.zip && rm -rf md5sums.txt -
Download the data from
and unzip it in the
datadirectory.zenodo_get 10.5281/zenodo.7058567 unzip data.zip rm -rf data.zip && rm -rf md5sums.txtThe final directory after retrieving pre-trained models and sample data should look like this:
${mbw}
 `-- data
     `-- Chimpanzee
         |-- annot/
         |-- images/

 `-- models
     |-- detector/
     |-- flow/
     |-- mvnrsfm/
./scripts/unit_tests.sh
./scripts/train.sh
./scripts/eval.sh
./scripts/visualize.sh
Please run demo.ipynb to play around and see visualizations of labels in the provided Jupyter notebook. We provide tools to visualize the 2D predictions (along with a confidence flag of Accept or Reject). The reconstructed 3D could also be visualized via an interactive plotly visualization tool.
If you use our code, dataset, or models in your research, please cite with:
@inproceedings{dabhi2022mbw,
	title={MBW: Multi-view Bootstrapping in the Wild},
	author={Dabhi, Mosam and Wang, Chaoyang and Clifford, Tim and Jeni, Laszlo and Fasel, Ian and Lucey, Simon},
	booktitle={Thirty-sixth Conference on Neural Information Processing Systems Datasets and Benchmarks Track},
	year={2022},
	ee = {https://openreview.net/forum?id=i1bFPSw42W0},
	organization={NeurIPS}
}


@inproceedings{dabhi2021mvnrsfm,
	title={High Fidelity 3D Reconstructions with Limited Physical Views},
	author={Dabhi, Mosam and Wang, Chaoyang and Saluja, Kunal and Jeni, Laszlo and Fasel, Ian and Lucey, Simon},
	booktitle={2021 International Conference on 3D Vision (3DV)},
	year={2021},
	ee = {https://ieeexplore.ieee.org/abstract/document/9665845},
	organization={IEEE}
}

